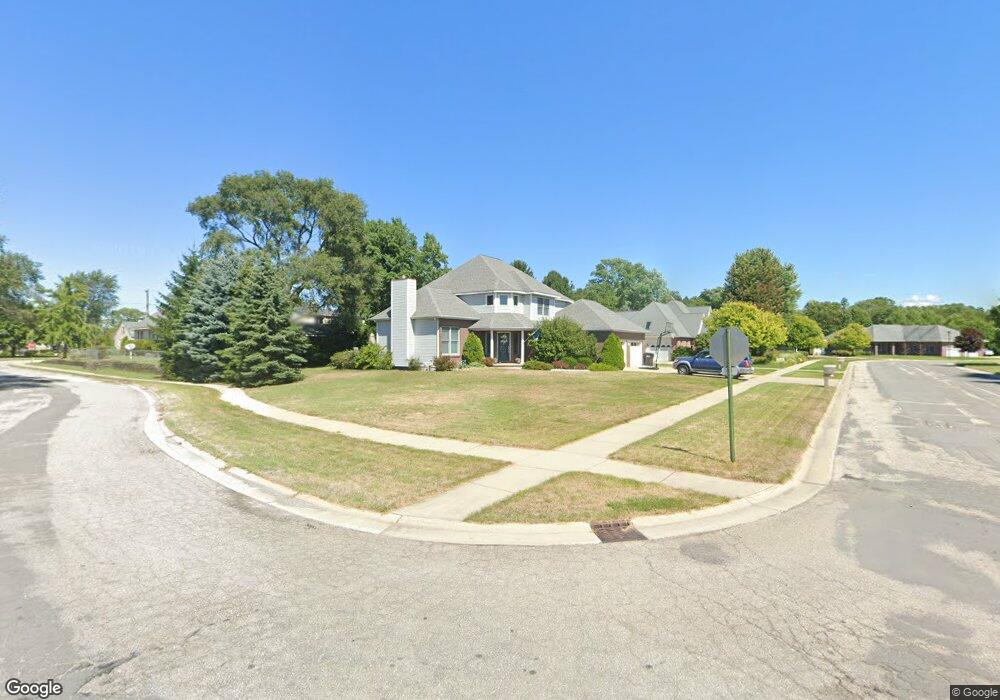
3807 Strawberry Row Bridgman, MI 49106
Estimated Value: $457,000 - $496,175
4
Beds
3
Baths
2,643
Sq Ft
$179/Sq Ft
Est. Value
About This Home
This home is located at 3807 Strawberry Row, Bridgman, MI 49106 and is currently estimated at $472,044, approximately $178 per square foot. 3807 Strawberry Row is a home located in Berrien County with nearby schools including Bridgman Elementary School, F.C. Reed Middle School, and Bridgman High School.
Ownership History
Date
Name
Owned For
Owner Type
Purchase Details
Closed on
Jan 24, 2014
Sold by
Deering Gayla Rae
Bought by
Deering Michael John
Current Estimated Value
Purchase Details
Closed on
Feb 11, 2010
Sold by
Kratt Thomas A and Kratt Kimberly H
Bought by
Deering Michael and Deering Gayla
Home Financials for this Owner
Home Financials are based on the most recent Mortgage that was taken out on this home.
Original Mortgage
$252,345
Outstanding Balance
$169,826
Interest Rate
5.37%
Mortgage Type
FHA
Estimated Equity
$302,218
Purchase Details
Closed on
Jan 13, 2005
Sold by
Harris Richard and Harris Michelle
Bought by
Kratt Thomas A and Kratt Kimberly H
Home Financials for this Owner
Home Financials are based on the most recent Mortgage that was taken out on this home.
Original Mortgage
$212,400
Interest Rate
5.77%
Mortgage Type
Unknown
Create a Home Valuation Report for This Property
The Home Valuation Report is an in-depth analysis detailing your home's value as well as a comparison with similar homes in the area
Home Values in the Area
Average Home Value in this Area
Purchase History
| Date | Buyer | Sale Price | Title Company |
|---|---|---|---|
| Deering Michael John | -- | None Available | |
| Deering Michael | $257,000 | Stewart Title Guaranty Co | |
| Kratt Thomas A | $253,000 | -- |
Source: Public Records
Mortgage History
| Date | Status | Borrower | Loan Amount |
|---|---|---|---|
| Open | Deering Michael | $252,345 | |
| Previous Owner | Kratt Thomas A | $212,400 |
Source: Public Records
Tax History Compared to Growth
Tax History
| Year | Tax Paid | Tax Assessment Tax Assessment Total Assessment is a certain percentage of the fair market value that is determined by local assessors to be the total taxable value of land and additions on the property. | Land | Improvement |
|---|---|---|---|---|
| 2025 | $6,491 | $228,800 | $0 | $0 |
| 2024 | $6,260 | $205,200 | $0 | $0 |
| 2023 | $5,113 | $155,100 | $0 | $0 |
| 2022 | $4,870 | $154,500 | $0 | $0 |
| 2021 | $4,928 | $196,500 | $12,500 | $184,000 |
| 2020 | $4,856 | $185,300 | $0 | $0 |
| 2019 | $4,772 | $161,000 | $0 | $0 |
| 2018 | $4,655 | $161,000 | $0 | $0 |
| 2017 | $4,580 | $160,900 | $0 | $0 |
| 2016 | $4,490 | $142,100 | $0 | $0 |
| 2015 | $4,474 | $162,100 | $0 | $0 |
| 2014 | $4,250 | $132,200 | $16,800 | $115,400 |
Source: Public Records
Map
Nearby Homes
- 9992 Gast Rd
- 0 Gast Rd Unit 24006127
- 4019 Sugarsand Ln
- 3990 Sugarsand Ln
- 4043 Sugarsand Ln
- 3995 Sugarsand Ln
- Elements 2100 Plan at Lake Haven - Elements
- Integrity 2060 Plan at Lake Haven
- Integrity 1250 Plan at Lake Haven
- Integrity 1560 Plan at Lake Haven
- Elements 1870 Plan at Lake Haven - Elements
- Integrity 1800 Plan at Lake Haven
- Integrity 1910 Plan at Lake Haven
- Elements 2700 Plan at Lake Haven - Elements
- Elements 1800 Plan at Lake Haven - Elements
- Elements 2390 Plan at Lake Haven - Elements
- Integrity 1750 Plan at Lake Haven
- Integrity 1880 Plan at Lake Haven
- Integrity 1610 Plan at Lake Haven
- Integrity 2080 Plan at Lake Haven
- 3787 Strawberry Row
- 3797 Strawberry Row
- 9761 Tower St
- 3827 Strawberry Row
- 3804 Lake St
- 3798 Lake St
- 3845 Strawberry Row
- 9762 Tower St
- 9760 Niagara Row
- 9773 Tower St
- 3788 Lake St
- 3832 Lake St
- 3780 Lake St
- 9774 Tower St
- 0 Tower St
- 3844 Lake St
- 9791 Tower St
- 9761 Concord Row
- 3770 Lake St
- 3765 Strawberry Row