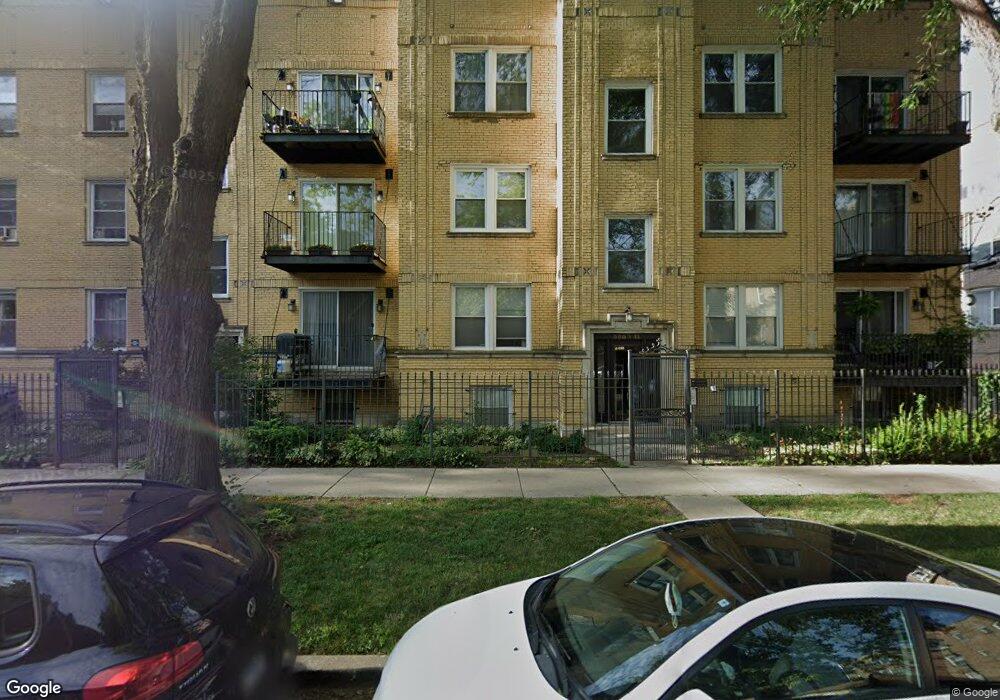
3807 W Ainslie St Unit 2M Chicago, IL 60625
Albany Park NeighborhoodEstimated Value: $199,000 - $231,000
2
Beds
1
Bath
900
Sq Ft
$238/Sq Ft
Est. Value
About This Home
This home is located at 3807 W Ainslie St Unit 2M, Chicago, IL 60625 and is currently estimated at $214,425, approximately $238 per square foot. 3807 W Ainslie St Unit 2M is a home located in Cook County with nearby schools including Volta Elementary School, Roosevelt High School, and ASPIRA Haugan Middle School.
Ownership History
Date
Name
Owned For
Owner Type
Purchase Details
Closed on
Sep 14, 2021
Sold by
Weber Daniel A and Pina Lorca Solange
Bought by
Klim Slawomir and Klim Magda
Current Estimated Value
Home Financials for this Owner
Home Financials are based on the most recent Mortgage that was taken out on this home.
Original Mortgage
$126,000
Outstanding Balance
$96,871
Interest Rate
2.5%
Mortgage Type
New Conventional
Estimated Equity
$117,554
Purchase Details
Closed on
Sep 9, 2005
Sold by
3801 & 11 Anslie Llc
Bought by
Weber Daniel A and Pina Lorca Solange A
Home Financials for this Owner
Home Financials are based on the most recent Mortgage that was taken out on this home.
Original Mortgage
$199,900
Interest Rate
5.93%
Mortgage Type
Fannie Mae Freddie Mac
Create a Home Valuation Report for This Property
The Home Valuation Report is an in-depth analysis detailing your home's value as well as a comparison with similar homes in the area
Home Values in the Area
Average Home Value in this Area
Purchase History
| Date | Buyer | Sale Price | Title Company |
|---|---|---|---|
| Klim Slawomir | $157,500 | Attorney | |
| Weber Daniel A | $200,000 | Chicago Title Insurance Comp |
Source: Public Records
Mortgage History
| Date | Status | Borrower | Loan Amount |
|---|---|---|---|
| Open | Klim Slawomir | $126,000 | |
| Previous Owner | Weber Daniel A | $199,900 |
Source: Public Records
Tax History Compared to Growth
Tax History
| Year | Tax Paid | Tax Assessment Tax Assessment Total Assessment is a certain percentage of the fair market value that is determined by local assessors to be the total taxable value of land and additions on the property. | Land | Improvement |
|---|---|---|---|---|
| 2024 | $2,262 | $19,061 | $2,268 | $16,793 |
| 2023 | $2,890 | $14,000 | $1,815 | $12,185 |
| 2022 | $2,890 | $14,000 | $1,815 | $12,185 |
| 2021 | $2,152 | $13,999 | $1,814 | $12,185 |
| 2020 | $2,133 | $12,644 | $939 | $11,705 |
| 2019 | $2,173 | $14,211 | $939 | $13,272 |
| 2018 | $2,135 | $14,211 | $939 | $13,272 |
| 2017 | $1,814 | $11,772 | $842 | $10,930 |
| 2016 | $1,864 | $11,772 | $842 | $10,930 |
| 2015 | $1,682 | $11,772 | $842 | $10,930 |
| 2014 | $1,875 | $12,637 | $777 | $11,860 |
| 2013 | $1,827 | $12,637 | $777 | $11,860 |
Source: Public Records
Map
Nearby Homes
- 3849 W Ainslie St Unit 1
- 4855 N Springfield Ave Unit 3
- 4900 N Lawndale Ave Unit G
- 3908 W Ainslie St Unit G
- 4855 N Harding Ave Unit 2
- 4833 N Harding Ave Unit 1
- 4833 N Harding Ave Unit GDN
- 3711 W Lawrence Ave
- 5026 N Hamlin Ave
- 5010 N Lawndale Ave
- 5007 N Lawndale Ave
- 4923 N Pulaski Rd
- 3618 W Ainslie St Unit 3W
- 4903 N Monticello Ave Unit 3
- 5038 N Harding Ave
- 5107 N Springfield Ave Unit B
- 5115 N Springfield Ave Unit B
- 4906 N Drake Ave Unit 3
- 4624 N Springfield Ave
- 4035 W Argyle St
- 3811 W Ainslie St Unit 2W
- 3807 W Ainslie St Unit 3M
- 3811 W Ainslie St Unit 3E
- 3811 W Ainslie St Unit 2E
- 3807 W Ainslie St Unit B
- 3807 W Ainslie St Unit 1M
- 3811 W Ainslie St Unit 1W
- 3807 W Ainslie St Unit 2
- 3801 W Ainslie St Unit 3W
- 3801 W Ainslie St Unit 2W
- 3801 W Ainslie St Unit 1W
- 3801 W Ainslie St Unit P2
- 3801 W Ainslie St Unit 1E
- 3801 W Ainslie St Unit P4
- 3801 W Ainslie St Unit P1
- 3801 W Ainslie St Unit P3
- 3801 W Ainslie St Unit P5
- 3801 W Ainslie St Unit 2E
- 3801 W Ainslie St Unit 3
- 4848 N Hamlin Ave