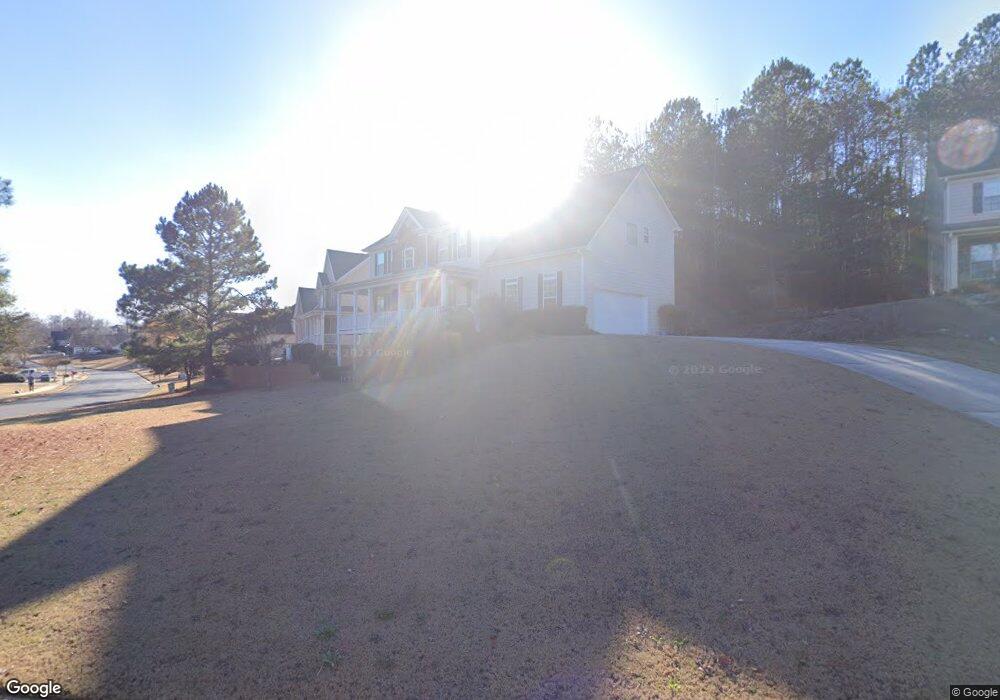
3808 Bogan Creek Ct NE Buford, GA 30519
Estimated Value: $473,000 - $595,000
4
Beds
2
Baths
3,086
Sq Ft
$168/Sq Ft
Est. Value
About This Home
This home is located at 3808 Bogan Creek Ct NE, Buford, GA 30519 and is currently estimated at $519,629, approximately $168 per square foot. 3808 Bogan Creek Ct NE is a home located in Gwinnett County with nearby schools including Harmony Elementary School and Glenn C. Jones Middle School.
Ownership History
Date
Name
Owned For
Owner Type
Purchase Details
Closed on
Mar 2, 2023
Sold by
Nguyen Vincent
Bought by
Nguyen Vincent and Dang Ngoc Tram
Current Estimated Value
Home Financials for this Owner
Home Financials are based on the most recent Mortgage that was taken out on this home.
Original Mortgage
$342,000
Outstanding Balance
$325,705
Interest Rate
6.09%
Mortgage Type
New Conventional
Estimated Equity
$193,924
Purchase Details
Closed on
Mar 2, 2017
Sold by
Imran Jamil
Bought by
Imran Jamil Hossain and Jamil Hossain Imran Trust
Purchase Details
Closed on
Mar 24, 2015
Sold by
Imran Jamil
Bought by
Imran Jamil and Ahtasham Durdana
Purchase Details
Closed on
Dec 22, 2011
Sold by
Poth Louis Leonard
Bought by
Imran Jamil
Purchase Details
Closed on
Sep 18, 2006
Sold by
Bowbritt Llc
Bought by
Poth Louis L and Poth Laurel F
Home Financials for this Owner
Home Financials are based on the most recent Mortgage that was taken out on this home.
Original Mortgage
$235,000
Interest Rate
6.48%
Mortgage Type
New Conventional
Create a Home Valuation Report for This Property
The Home Valuation Report is an in-depth analysis detailing your home's value as well as a comparison with similar homes in the area
Home Values in the Area
Average Home Value in this Area
Purchase History
| Date | Buyer | Sale Price | Title Company |
|---|---|---|---|
| Nguyen Vincent | -- | -- | |
| Nguyen Vincent | $427,500 | -- | |
| Imran Jamil Hossain | -- | -- | |
| Imran Jamil | -- | -- | |
| Imran Jamil | $210,000 | -- | |
| Poth Louis L | $285,000 | -- |
Source: Public Records
Mortgage History
| Date | Status | Borrower | Loan Amount |
|---|---|---|---|
| Open | Nguyen Vincent | $342,000 | |
| Previous Owner | Poth Louis L | $235,000 |
Source: Public Records
Tax History Compared to Growth
Tax History
| Year | Tax Paid | Tax Assessment Tax Assessment Total Assessment is a certain percentage of the fair market value that is determined by local assessors to be the total taxable value of land and additions on the property. | Land | Improvement |
|---|---|---|---|---|
| 2024 | $6,483 | $171,000 | $39,600 | $131,400 |
| 2023 | $6,483 | $201,840 | $39,600 | $162,240 |
| 2022 | $0 | $201,840 | $39,600 | $162,240 |
| 2021 | $0 | $161,080 | $30,720 | $130,360 |
| 2020 | $6,224 | $161,080 | $30,720 | $130,360 |
| 2019 | $4,909 | $161,080 | $30,720 | $130,360 |
| 2018 | $5,318 | $141,520 | $28,000 | $113,520 |
| 2016 | $4,864 | $128,160 | $25,600 | $102,560 |
| 2015 | $4,343 | $111,960 | $18,400 | $93,560 |
| 2014 | $4,100 | $104,480 | $18,400 | $86,080 |
Source: Public Records
Map
Nearby Homes
- 3685 Rolling Creek Dr
- 4041 Lost Mill Ln
- 3665 Mystic Dr Unit 2
- 2692 Bogan Creek Dr
- 2753 Blue Moon Dr Unit 4
- 3775 Rolling Creek Dr
- 2551 E Maddox Rd
- 3765 Woodlawn Ct
- 2361 Black Bear Ct Unit 2
- 2330 Chandler Grove Dr
- 3848 Heirloom Loop Ct
- 4017 S South Bogan Rd
- 2859 Presertve at Hamilton Mill
- 3964 Hamilton Mill Rd
- 2859 Preserve Walk Ct NE
- 2101 E Maddox Rd
- 2810 Promenade Place
- 3808 Bogan Creek Ct
- 3650 Rolling Creek Dr
- 3818 Bogan Creek Ct Unit 25
- 3818 Bogan Creek Ct
- 0 Rolling Creek Dr NE Unit 8533172
- 0 Rolling Creek Dr NE Unit 8478616
- 0 Rolling Creek Dr NE Unit 8408575
- 0 Rolling Creek Dr NE Unit 8319785
- 0 Rolling Creek Dr NE Unit 8170306
- 0 Rolling Creek Dr NE Unit 7629328
- 0 Rolling Creek Dr NE Unit 7633788
- 0 Rolling Creek Dr NE Unit 7563142
- 0 Rolling Creek Dr NE Unit 3147452
- 0 Rolling Creek Dr NE Unit 8406784
- 0 Rolling Creek Dr NE Unit 7058470
- 0 Rolling Creek Dr NE Unit 8565343
- 0 Rolling Creek Dr NE Unit 9020867
- 0 Rolling Creek Dr NE Unit 9059246
- 0 Rolling Creek Dr NE Unit 3199398
- 0 Rolling Creek Dr NE Unit 3236763