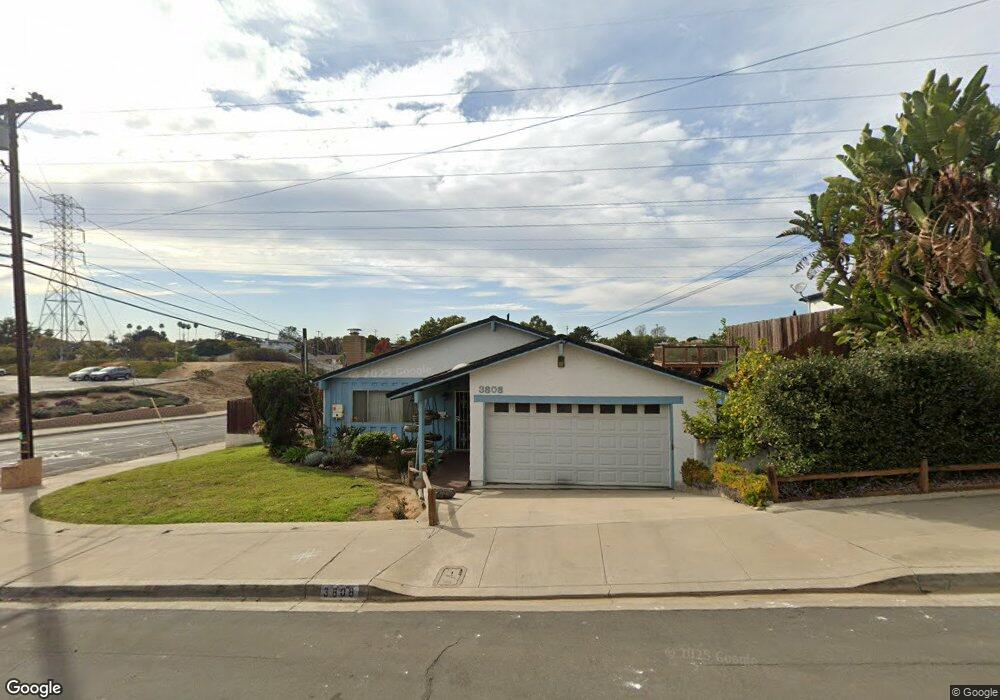
3808 Canning Ave San Diego, CA 92111
Clairemont Mesa West NeighborhoodEstimated Value: $1,123,000 - $1,310,000
4
Beds
2
Baths
1,691
Sq Ft
$726/Sq Ft
Est. Value
About This Home
This home is located at 3808 Canning Ave, San Diego, CA 92111 and is currently estimated at $1,227,185, approximately $725 per square foot. 3808 Canning Ave is a home located in San Diego County with nearby schools including Holmes Elementary, Marston Middle School, and Clairemont High School.
Ownership History
Date
Name
Owned For
Owner Type
Purchase Details
Closed on
Jul 27, 2025
Sold by
Alluin Laura Minkin
Bought by
Alluin Laura Minkin
Current Estimated Value
Home Financials for this Owner
Home Financials are based on the most recent Mortgage that was taken out on this home.
Original Mortgage
$100,000
Outstanding Balance
$99,915
Interest Rate
6.81%
Mortgage Type
New Conventional
Estimated Equity
$1,127,270
Purchase Details
Closed on
Sep 9, 2014
Sold by
Braley Donald H
Bought by
Alluin Laura Minkin
Home Financials for this Owner
Home Financials are based on the most recent Mortgage that was taken out on this home.
Original Mortgage
$500,000
Interest Rate
3.37%
Mortgage Type
Adjustable Rate Mortgage/ARM
Purchase Details
Closed on
May 12, 2004
Sold by
Braley Donald H
Bought by
Braley Donald H
Create a Home Valuation Report for This Property
The Home Valuation Report is an in-depth analysis detailing your home's value as well as a comparison with similar homes in the area
Home Values in the Area
Average Home Value in this Area
Purchase History
| Date | Buyer | Sale Price | Title Company |
|---|---|---|---|
| Alluin Laura Minkin | -- | None Listed On Document | |
| Alluin Laura Minkin | $500,000 | Chicago Title Company | |
| Braley Donald H | -- | -- |
Source: Public Records
Mortgage History
| Date | Status | Borrower | Loan Amount |
|---|---|---|---|
| Open | Alluin Laura Minkin | $100,000 | |
| Previous Owner | Alluin Laura Minkin | $500,000 |
Source: Public Records
Tax History Compared to Growth
Tax History
| Year | Tax Paid | Tax Assessment Tax Assessment Total Assessment is a certain percentage of the fair market value that is determined by local assessors to be the total taxable value of land and additions on the property. | Land | Improvement |
|---|---|---|---|---|
| 2025 | $7,184 | $600,913 | $269,359 | $331,554 |
| 2024 | $7,184 | $589,131 | $264,078 | $325,053 |
| 2023 | $7,024 | $577,580 | $258,900 | $318,680 |
| 2022 | $6,835 | $566,256 | $253,824 | $312,432 |
| 2021 | $6,787 | $555,154 | $248,848 | $306,306 |
| 2020 | $6,704 | $549,463 | $246,297 | $303,166 |
| 2019 | $6,583 | $538,690 | $241,468 | $297,222 |
| 2018 | $6,236 | $528,129 | $236,734 | $291,395 |
| 2017 | $6,088 | $517,775 | $232,093 | $285,682 |
| 2016 | $5,991 | $507,624 | $227,543 | $280,081 |
| 2015 | $5,902 | $500,000 | $224,126 | $275,874 |
| 2014 | $1,816 | $158,442 | $71,022 | $87,420 |
Source: Public Records
Map
Nearby Homes
- 3855 Mount Blackburn Ave
- 3942 Mount Acadia Blvd
- 5252 Mount Blanca Dr
- 3635 Mount Abbey Ave
- 3581 Mount Abbey Ave
- 3567 Mount Everest Blvd
- 5273 Mount Alifan Dr
- 3526 Mount Abbey Ave
- 5289 Mount Alifan Dr
- 5581 Mount Acara Dr
- 5507 Caminito Roberto
- 5696 Caminito Roberto
- 3516 Old Cobble Rd
- 5230 Mount Alifan Dr
- 5606 Caminito Roberto
- 4870 Mount Armour Dr
- 4182 Mount Alifan Place Unit G
- 3816 Mount Abraham Ave
- 4108 Genesee Ave
- 4110 Genesee Ave
- 3818 Canning Ave
- 3828 Canning Ave
- 3811 Canning Ave
- 3838 Canning Ave
- 3823 Canning Ave
- 5262 Mount Ararat Dr
- 5136 Mount Ararat Dr
- 3833 Canning Ave
- 3848 Canning Ave
- 5272 Mount Ararat Dr
- 3843 Canning Ave
- 3822 Cameo Ln
- 5135 Mount Ararat Dr
- 3831 Mount Ariane Dr
- 5277 Mount Ararat Dr
- 3812 Cameo Ln
- 3837 Mount Ariane Dr
- 3858 Canning Ave
- 3823 Mount Ariane Dr
- 3809 Mount Ariane Dr