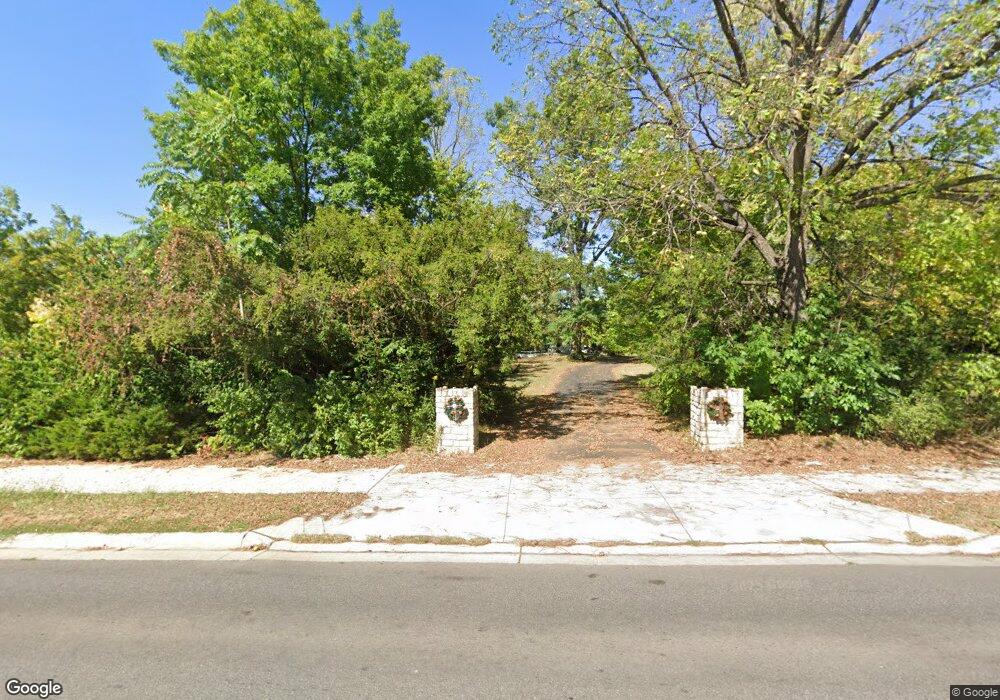
3808 Henderson Rd Columbus, OH 43220
Estimated Value: $250,000 - $258,000
3
Beds
2
Baths
1,300
Sq Ft
$195/Sq Ft
Est. Value
About This Home
This home is located at 3808 Henderson Rd, Columbus, OH 43220 and is currently estimated at $253,949, approximately $195 per square foot. 3808 Henderson Rd is a home located in Franklin County with nearby schools including Greensview Elementary School, Hastings Middle School, and Upper Arlington High School.
Ownership History
Date
Name
Owned For
Owner Type
Purchase Details
Closed on
Sep 12, 2016
Sold by
Arthurs Travis J and Arthurs Brittney
Bought by
Hoskins Charles J
Current Estimated Value
Home Financials for this Owner
Home Financials are based on the most recent Mortgage that was taken out on this home.
Original Mortgage
$117,237
Outstanding Balance
$96,032
Interest Rate
4.25%
Mortgage Type
FHA
Estimated Equity
$157,917
Purchase Details
Closed on
Dec 15, 2011
Sold by
Johnson Ossie R
Bought by
Arthurs Travis J
Home Financials for this Owner
Home Financials are based on the most recent Mortgage that was taken out on this home.
Original Mortgage
$86,743
Interest Rate
4.5%
Mortgage Type
FHA
Purchase Details
Closed on
Nov 28, 1988
Bought by
Johnson Ossie R
Create a Home Valuation Report for This Property
The Home Valuation Report is an in-depth analysis detailing your home's value as well as a comparison with similar homes in the area
Home Values in the Area
Average Home Value in this Area
Purchase History
| Date | Buyer | Sale Price | Title Company |
|---|---|---|---|
| Hoskins Charles J | $119,400 | Chase Titl Box | |
| Arthurs Travis J | $89,000 | Real Living | |
| Johnson Ossie R | $67,500 | -- |
Source: Public Records
Mortgage History
| Date | Status | Borrower | Loan Amount |
|---|---|---|---|
| Open | Hoskins Charles J | $117,237 | |
| Previous Owner | Arthurs Travis J | $86,743 |
Source: Public Records
Tax History Compared to Growth
Tax History
| Year | Tax Paid | Tax Assessment Tax Assessment Total Assessment is a certain percentage of the fair market value that is determined by local assessors to be the total taxable value of land and additions on the property. | Land | Improvement |
|---|---|---|---|---|
| 2024 | $3,393 | $80,020 | $21,040 | $58,980 |
| 2023 | $3,361 | $80,010 | $21,035 | $58,975 |
| 2022 | $2,020 | $40,010 | $8,370 | $31,640 |
| 2021 | $2,026 | $40,010 | $8,370 | $31,640 |
| 2020 | $2,030 | $40,010 | $8,370 | $31,640 |
| 2019 | $2,051 | $36,160 | $7,280 | $28,880 |
| 2018 | $1,952 | $36,160 | $7,280 | $28,880 |
| 2017 | $1,945 | $36,160 | $7,280 | $28,880 |
| 2016 | $1,820 | $29,060 | $6,340 | $22,720 |
| 2015 | $1,840 | $29,060 | $6,340 | $22,720 |
| 2014 | $1,861 | $29,060 | $6,340 | $22,720 |
| 2013 | $820 | $30,590 | $6,685 | $23,905 |
Source: Public Records
Map
Nearby Homes
- 5227 Brynwood Dr
- 4499 Summit Ridge Rd
- 2744 Greystone Dr Unit E
- 5322 Darlington Rd Unit E
- 5055 Slate Run Woods Ct
- 3119 Rivermill Dr Unit 24
- 5000 Slate Run Woods Ct
- 2491 Calais Way
- 5273 Brandy Oaks Ln
- 5275 Brandy Oaks Ln
- 5277 Brandy Oaks Ln
- 5297 Brandy Oaks Ln Unit 5297
- 2585 Trottersway Dr Unit 2585
- 5294 Brandy Oaks Ln
- 2622 Trottersway Dr
- 2522 Gardenia Dr Unit 16C
- 5672 Barry Trace Unit 5672
- 5657 Barry Trace
- 2560 Trotterslane Dr
- 4390 Dublin Rd
- 3816 Henderson Rd
- 3800 Henderson Rd
- 3800 Henderson Rd
- 3815 Henderson Rd
- 3827 Henderson Rd
- 3835 Henderson Rd
- 3793 Henderson Rd
- 3794 Henderson Rd
- 3795 Henderson Rd
- 3784 Henderson Rd
- 3845 W Henderson Rd
- 3845 Henderson Rd
- 3843 Henderson Rd
- 3849 W Henderson Rd
- 3772 Henderson Rd
- 3773 Henderson Rd
- 3849 Henderson Rd
- 3853 Henderson Rd
- 3781 W Henderson Rd
- 3830 Henderson Rd