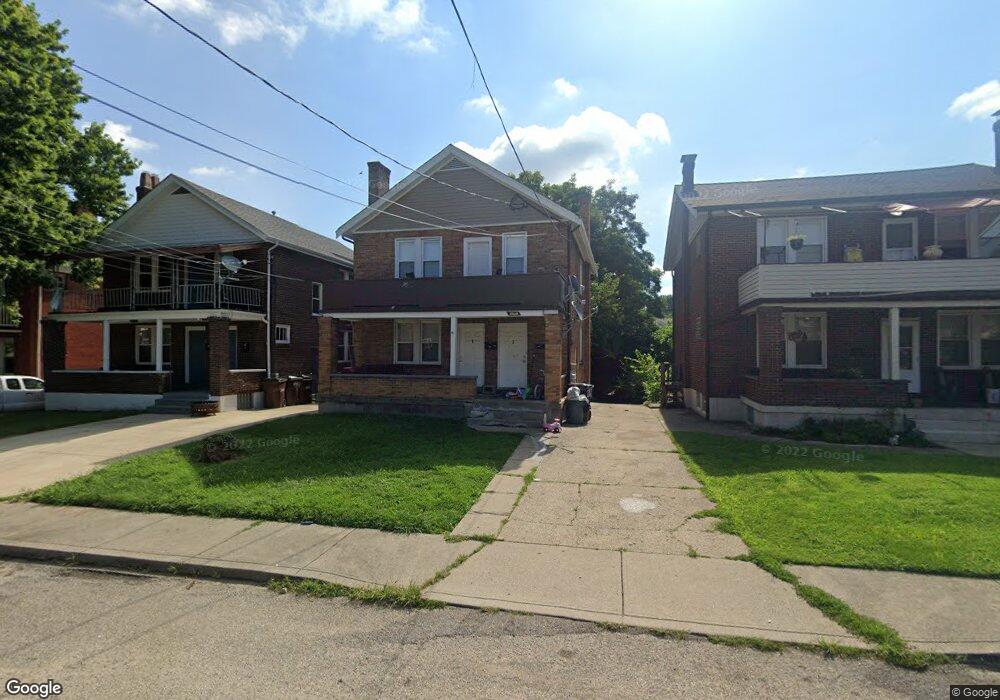
3808 Kenker Place Cincinnati, OH 45211
Estimated Value: $209,097 - $241,000
5
Beds
2
Baths
1,900
Sq Ft
$116/Sq Ft
Est. Value
About This Home
This home is located at 3808 Kenker Place, Cincinnati, OH 45211 and is currently estimated at $220,274, approximately $115 per square foot. 3808 Kenker Place is a home located in Hamilton County with nearby schools including Cheviot Elementary School, Western Hills High School, and Gilbert A. Dater High School.
Ownership History
Date
Name
Owned For
Owner Type
Purchase Details
Closed on
Aug 9, 2004
Sold by
Abn Amro Mortgage Group Inc
Bought by
Armstrong Properties Ltd
Current Estimated Value
Purchase Details
Closed on
Feb 26, 2003
Sold by
Koeninger Ann
Bought by
Abn Amro Mortgage Group Inc
Purchase Details
Closed on
Sep 26, 2001
Sold by
Roth Daniel T and Roth Daniel J
Bought by
Koeninger Ann
Home Financials for this Owner
Home Financials are based on the most recent Mortgage that was taken out on this home.
Original Mortgage
$109,250
Interest Rate
6.99%
Purchase Details
Closed on
Oct 8, 1996
Sold by
Lockwood David A and Lockwood Jill M
Bought by
Roth Daniel J
Purchase Details
Closed on
Mar 7, 1994
Sold by
Ohlmansiek Ervin
Bought by
Lockwood David A and Lockwood Jill M
Home Financials for this Owner
Home Financials are based on the most recent Mortgage that was taken out on this home.
Original Mortgage
$46,870
Interest Rate
7.04%
Create a Home Valuation Report for This Property
The Home Valuation Report is an in-depth analysis detailing your home's value as well as a comparison with similar homes in the area
Home Values in the Area
Average Home Value in this Area
Purchase History
| Date | Buyer | Sale Price | Title Company |
|---|---|---|---|
| Armstrong Properties Ltd | -- | Cardinal Title Company | |
| Abn Amro Mortgage Group Inc | $80,000 | -- | |
| Koeninger Ann | $115,000 | -- | |
| Roth Daniel J | -- | -- | |
| Lockwood David A | -- | -- |
Source: Public Records
Mortgage History
| Date | Status | Borrower | Loan Amount |
|---|---|---|---|
| Previous Owner | Koeninger Ann | $109,250 | |
| Previous Owner | Lockwood David A | $46,870 |
Source: Public Records
Tax History Compared to Growth
Tax History
| Year | Tax Paid | Tax Assessment Tax Assessment Total Assessment is a certain percentage of the fair market value that is determined by local assessors to be the total taxable value of land and additions on the property. | Land | Improvement |
|---|---|---|---|---|
| 2024 | $3,139 | $49,088 | $5,646 | $43,442 |
| 2023 | $3,144 | $49,088 | $5,646 | $43,442 |
| 2022 | $2,314 | $31,326 | $4,890 | $26,436 |
| 2021 | $2,303 | $31,326 | $4,890 | $26,436 |
| 2020 | $2,279 | $31,326 | $4,890 | $26,436 |
| 2019 | $2,253 | $27,720 | $4,326 | $23,394 |
| 2018 | $2,254 | $27,720 | $4,326 | $23,394 |
| 2017 | $2,184 | $27,720 | $4,326 | $23,394 |
| 2016 | $1,842 | $22,712 | $5,282 | $17,430 |
| 2015 | $1,659 | $22,712 | $5,282 | $17,430 |
| 2014 | $1,621 | $22,712 | $5,282 | $17,430 |
| 2013 | $1,597 | $22,051 | $5,128 | $16,923 |
Source: Public Records
Map
Nearby Homes
- 3832 Meyerfeld Ave
- 3836 N Bend Rd
- 3418 Gamble Ave
- 3415 Gamble Ave
- 3498 Boudinot Ave
- 3613 Everett Ave
- 3846 Davis Ave
- 3519 Mozart Ave
- 2950 Feltz Ave
- 3502 Woodbine Ave
- 3022 Urwiler Ave
- 3827 Boudinot Ave
- 2932 Feltz Ave
- 2919 Temple Ave
- 3732 High Point Ave
- 3424 Craig Ave
- 3032 Junietta Ave
- 2908 Montclair Ave
- 3637 Woodbine Ave
- 3636 Herbert Ave
- 3810 Kenker Place
- 3806 Kenker Place
- 3812 Kenker Place
- 3804 Kenker Place
- 3645 Boudinot Ave
- 3814 Kenker Place
- 3639 Boudinot Ave
- 3649 Boudinot Ave
- 3807 Kenker Place
- 3805 Kenker Place
- 3807 Kenker Place
- 3809 Kenker Place
- 3637 Boudinot Ave
- 3805 Kenker Place
- 3651 Boudinot Ave
- 3811 Kenker Place
- 3818 Kenker Place
- 3813 Kenker Place
- 3653 Boudinot Ave
- 3822 Kenker Place