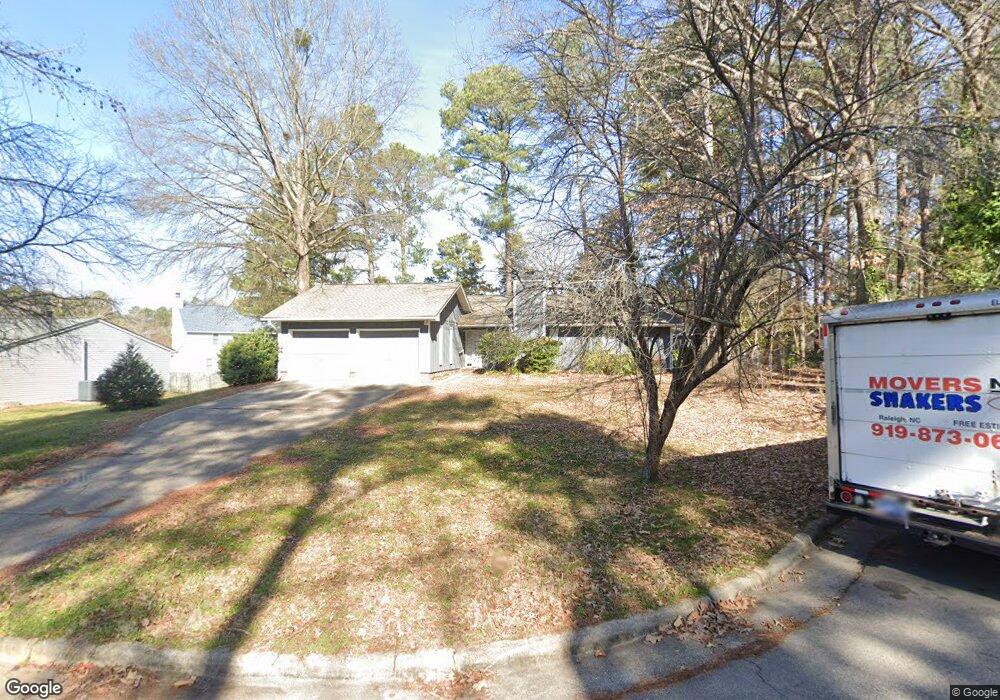
3809 Cascade Ct Raleigh, NC 27604
Atlantic NeighborhoodEstimated Value: $340,000 - $369,000
3
Beds
2
Baths
1,535
Sq Ft
$233/Sq Ft
Est. Value
About This Home
This home is located at 3809 Cascade Ct, Raleigh, NC 27604 and is currently estimated at $358,358, approximately $233 per square foot. 3809 Cascade Ct is a home located in Wake County with nearby schools including East Millbrook Middle, Heritage High School, and Raleigh Christian Academy.
Ownership History
Date
Name
Owned For
Owner Type
Purchase Details
Closed on
Nov 17, 2014
Sold by
State Employees Cu
Bought by
Secu Re Inc
Current Estimated Value
Purchase Details
Closed on
Oct 15, 2014
Sold by
Pariz Marcelo Mercadante and Pariz Frances
Bought by
State Employees Cu
Purchase Details
Closed on
Sep 11, 2007
Sold by
State Employees Cu
Bought by
Pariz Marcelo Marcandante and Thomas Frances Careen
Home Financials for this Owner
Home Financials are based on the most recent Mortgage that was taken out on this home.
Original Mortgage
$145,000
Interest Rate
5.75%
Mortgage Type
Purchase Money Mortgage
Purchase Details
Closed on
Apr 23, 2007
Sold by
Parrish William Edward
Bought by
State Employees Cu
Purchase Details
Closed on
Dec 23, 1997
Sold by
Chen Roger
Bought by
Parrish William E
Home Financials for this Owner
Home Financials are based on the most recent Mortgage that was taken out on this home.
Original Mortgage
$100,725
Interest Rate
7.23%
Create a Home Valuation Report for This Property
The Home Valuation Report is an in-depth analysis detailing your home's value as well as a comparison with similar homes in the area
Home Values in the Area
Average Home Value in this Area
Purchase History
| Date | Buyer | Sale Price | Title Company |
|---|---|---|---|
| Secu Re Inc | $130,000 | None Available | |
| State Employees Cu | $162,500 | None Available | |
| Pariz Marcelo Marcandante | $145,000 | None Available | |
| State Employees Cu | $130,312 | None Available | |
| Parrish William E | $118,500 | -- |
Source: Public Records
Mortgage History
| Date | Status | Borrower | Loan Amount |
|---|---|---|---|
| Previous Owner | Pariz Marcelo Marcandante | $145,000 | |
| Previous Owner | Parrish William E | $100,725 |
Source: Public Records
Tax History Compared to Growth
Tax History
| Year | Tax Paid | Tax Assessment Tax Assessment Total Assessment is a certain percentage of the fair market value that is determined by local assessors to be the total taxable value of land and additions on the property. | Land | Improvement |
|---|---|---|---|---|
| 2025 | $3,061 | $348,750 | $140,000 | $208,750 |
| 2024 | $3,049 | $348,750 | $140,000 | $208,750 |
| 2023 | $2,208 | $200,743 | $55,000 | $145,743 |
| 2022 | $2,053 | $200,743 | $55,000 | $145,743 |
| 2021 | $1,973 | $200,743 | $55,000 | $145,743 |
| 2020 | $1,938 | $200,743 | $55,000 | $145,743 |
| 2019 | $1,888 | $161,216 | $50,000 | $111,216 |
| 2018 | $1,781 | $161,216 | $50,000 | $111,216 |
| 2017 | $1,697 | $161,216 | $50,000 | $111,216 |
| 2016 | $1,662 | $161,216 | $50,000 | $111,216 |
| 2015 | -- | $152,283 | $40,000 | $112,283 |
| 2014 | $1,515 | $152,283 | $40,000 | $112,283 |
Source: Public Records
Map
Nearby Homes
- 3701 Saratoga Dr
- 3523 Greywood Dr
- 3531 Oneonta Ave
- 3521 Arrowwood Dr
- 3700 Huntleigh Dr
- 3721 Baugh St
- 3605 Satellite Ct
- 4236 Lake Ridge Dr Unit 11B
- 4204 Green Rd
- 3749 Bison Hill Ln
- 3735 Bison Hill Ln
- 3700 Summer Place
- 3607 Buffaloe Rd
- 3005 Huntleigh Dr
- 3523 Brentwood Rd
- 4361 Bona Ct
- 3635 Water Mist Ln
- 3117 Edgetone Dr
- 4463 Roller Ct
- 3636 Water Mist Ln
- 3805 Cascade Ct
- 3813 Cascade Ct
- 3608 Greywood Dr
- 3804 Chesnee Ct
- 3604 Greywood Dr
- 3612 Greywood Dr
- 3801 Cascade Ct
- 3812 Cascade Ct
- 3808 Cascade Ct
- 3817 Cascade Ct
- 3804 Cascade Ct
- 3816 Cascade Ct
- 3705 Saratoga Dr
- 3805 Chesnee Ct
- 3800 Cascade Ct
- 3616 Greywood Dr
- 3609 Greywood Dr
- 3113 Quinley Place
- 3117 Quinley Place
- 3115 Quinley Place