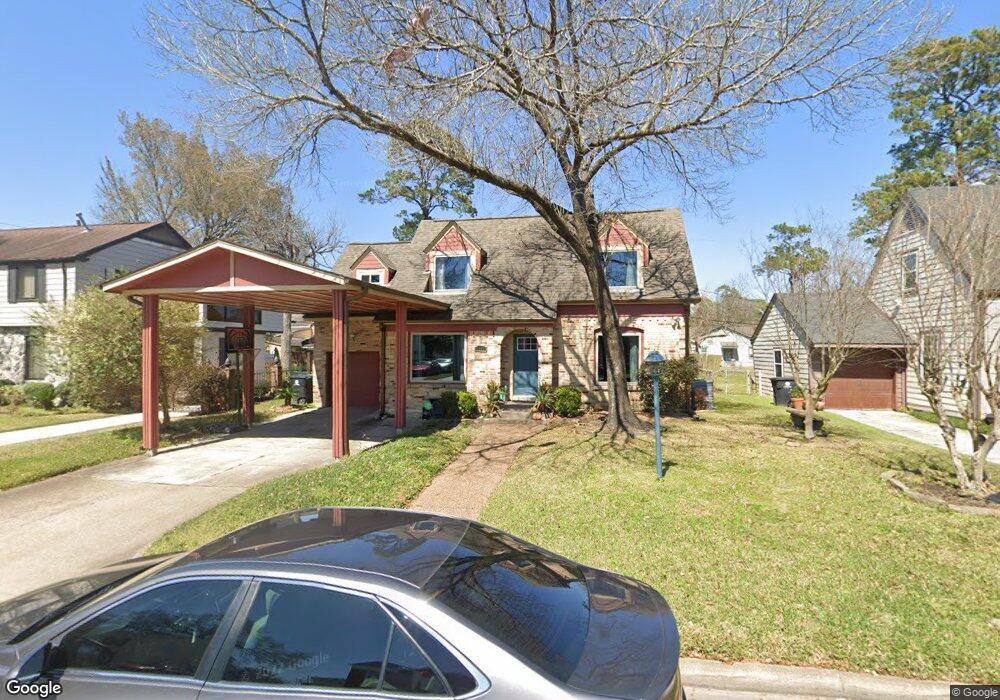
3809 Palm St Houston, TX 77004
MacGregor NeighborhoodEstimated Value: $369,000 - $538,000
4
Beds
3
Baths
1,900
Sq Ft
$234/Sq Ft
Est. Value
About This Home
This home is located at 3809 Palm St, Houston, TX 77004 and is currently estimated at $444,480, approximately $233 per square foot. 3809 Palm St is a home located in Harris County with nearby schools including Lockhart Elementary School, Cullen Middle School, and Yates High School.
Ownership History
Date
Name
Owned For
Owner Type
Purchase Details
Closed on
Aug 4, 2018
Sold by
Garva Jessica Noemi and Cass Clifford Dale
Bought by
Cass Clifford Dale and Garva Jessica Noemi
Current Estimated Value
Purchase Details
Closed on
Mar 14, 2014
Sold by
Batiste Billye W and Batiste Rayes Billye W
Bought by
Cass Ii Clifford Dale
Home Financials for this Owner
Home Financials are based on the most recent Mortgage that was taken out on this home.
Original Mortgage
$137,150
Interest Rate
4.27%
Mortgage Type
New Conventional
Purchase Details
Closed on
Jun 30, 2013
Sold by
Dehorney Jun R and Dehorney Shane V
Bought by
Rayes Larry J and Batiste-Rayes Billye W
Purchase Details
Closed on
Aug 31, 2009
Sold by
Rayes Larry J and Batiste Rayes Billye W
Bought by
Dehorney Jun R and Dehorney Shane
Create a Home Valuation Report for This Property
The Home Valuation Report is an in-depth analysis detailing your home's value as well as a comparison with similar homes in the area
Home Values in the Area
Average Home Value in this Area
Purchase History
| Date | Buyer | Sale Price | Title Company |
|---|---|---|---|
| Cass Clifford Dale | $1,000 | None Available | |
| Cass Ii Clifford Dale | -- | Commonwealth Title | |
| Rayes Larry J | -- | None Available | |
| Dehorney Jun R | -- | Pinnacle Title Co |
Source: Public Records
Mortgage History
| Date | Status | Borrower | Loan Amount |
|---|---|---|---|
| Previous Owner | Cass Ii Clifford Dale | $137,150 |
Source: Public Records
Tax History Compared to Growth
Tax History
| Year | Tax Paid | Tax Assessment Tax Assessment Total Assessment is a certain percentage of the fair market value that is determined by local assessors to be the total taxable value of land and additions on the property. | Land | Improvement |
|---|---|---|---|---|
| 2025 | $5,248 | $359,092 | $108,480 | $250,612 |
| 2024 | $5,248 | $364,744 | $108,480 | $256,264 |
| 2023 | $5,248 | $377,851 | $108,480 | $269,371 |
| 2022 | $7,513 | $331,300 | $108,480 | $222,820 |
| 2021 | $6,871 | $307,600 | $98,310 | $209,290 |
| 2020 | $6,798 | $268,000 | $98,310 | $169,690 |
| 2019 | $6,508 | $246,015 | $98,310 | $147,705 |
| 2018 | $4,479 | $234,973 | $81,360 | $153,613 |
| 2017 | $5,943 | $224,803 | $71,190 | $153,613 |
| 2016 | $4,955 | $187,429 | $71,190 | $116,239 |
| 2015 | $3,294 | $187,429 | $71,190 | $116,239 |
| 2014 | $3,294 | $128,151 | $47,460 | $80,691 |
Source: Public Records
Map
Nearby Homes
- 5108 Scott St
- 5121 Grantwood St
- 5114 Grantwood St
- 3834 Rosedale St
- 0 Southmore Blvd
- 3546 Rosedale St
- 3853 Rosedale St
- 3862 Wichita St
- 3854 Arbor St
- 3858 Arbor St
- 3511 Arbor St
- 0 S Macgregor Way Unit 94380145
- 3562 Rosewood St
- 3439 Wentworth St
- 3420 Rosedale St
- 3729 Rio Vista St
- 3620 S Macgregor Way
- 3418 Southmore Blvd
- 3827 Julius Ln
- 3411 Wentworth St