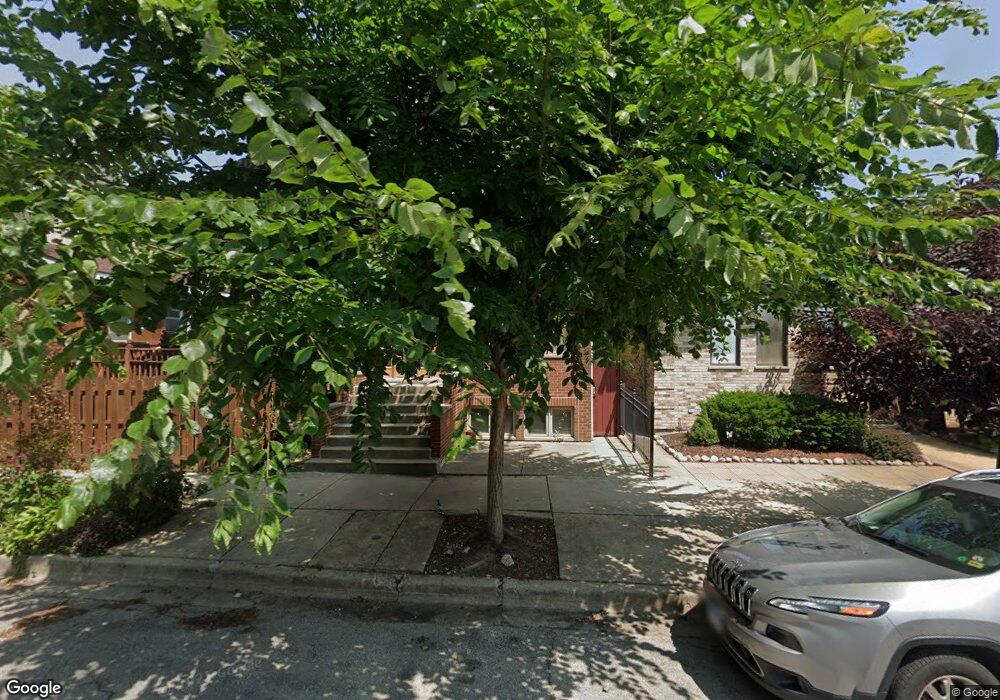
3809 S Parnell Ave Chicago, IL 60609
Bridgeport NeighborhoodEstimated Value: $792,113 - $925,000
4
Beds
4
Baths
3,200
Sq Ft
$265/Sq Ft
Est. Value
About This Home
This home is located at 3809 S Parnell Ave, Chicago, IL 60609 and is currently estimated at $849,278, approximately $265 per square foot. 3809 S Parnell Ave is a home located in Cook County with nearby schools including McClellan Elementary School, Bridgeport Catholic Academy - South Campus, and St Gabriel Elementary School.
Ownership History
Date
Name
Owned For
Owner Type
Purchase Details
Closed on
Sep 9, 2021
Sold by
Chen Jiazhao
Bought by
Sixth Gold Investment Llc
Current Estimated Value
Home Financials for this Owner
Home Financials are based on the most recent Mortgage that was taken out on this home.
Original Mortgage
$4,875,000
Outstanding Balance
$4,435,887
Interest Rate
2.8%
Mortgage Type
Commercial
Estimated Equity
-$3,586,609
Purchase Details
Closed on
Feb 27, 2015
Sold by
Calace Nicholas S
Bought by
Chen Jiazhao
Purchase Details
Closed on
Dec 10, 1999
Sold by
State Bank Of Countryside
Bought by
Calace Nicholas S and Calace Kelly
Home Financials for this Owner
Home Financials are based on the most recent Mortgage that was taken out on this home.
Original Mortgage
$260,000
Interest Rate
7.7%
Purchase Details
Closed on
Dec 11, 1997
Sold by
Frederickson Donald
Bought by
State Bank Of Countryside and Trust #93-1250
Create a Home Valuation Report for This Property
The Home Valuation Report is an in-depth analysis detailing your home's value as well as a comparison with similar homes in the area
Home Values in the Area
Average Home Value in this Area
Purchase History
| Date | Buyer | Sale Price | Title Company |
|---|---|---|---|
| Sixth Gold Investment Llc | -- | Accommodation | |
| Chen Jiazhao | $320,500 | None Available | |
| Calace Nicholas S | $289,000 | -- | |
| State Bank Of Countryside | $37,500 | -- |
Source: Public Records
Mortgage History
| Date | Status | Borrower | Loan Amount |
|---|---|---|---|
| Open | Sixth Gold Investment Llc | $4,875,000 | |
| Previous Owner | Calace Nicholas S | $260,000 |
Source: Public Records
Tax History Compared to Growth
Tax History
| Year | Tax Paid | Tax Assessment Tax Assessment Total Assessment is a certain percentage of the fair market value that is determined by local assessors to be the total taxable value of land and additions on the property. | Land | Improvement |
|---|---|---|---|---|
| 2024 | $10,894 | $65,000 | $16,350 | $48,650 |
| 2023 | $10,599 | $54,949 | $13,200 | $41,749 |
| 2022 | $10,599 | $54,949 | $13,200 | $41,749 |
| 2021 | $10,380 | $54,949 | $13,200 | $41,749 |
| 2020 | $8,080 | $39,375 | $13,200 | $26,175 |
| 2019 | $8,826 | $47,357 | $13,200 | $34,157 |
| 2018 | $8,676 | $47,357 | $13,200 | $34,157 |
| 2017 | $9,381 | $46,953 | $10,500 | $36,453 |
| 2016 | $8,904 | $46,953 | $10,500 | $36,453 |
| 2015 | $8,123 | $46,953 | $10,500 | $36,453 |
| 2014 | $7,122 | $40,956 | $9,000 | $31,956 |
| 2013 | $6,971 | $40,956 | $9,000 | $31,956 |
Source: Public Records
Map
Nearby Homes
- 3640 S Lowe Ave
- 3830 S Emerald Ave
- 3549 S Lowe Ave
- 3600 S Union Ave
- 3505 S Parnell Ave Unit D
- 3600 S Halsted St
- 3405 S Union Ave
- 835 W 35th St
- 3450 S Halsted St Unit 406
- 3357 S Emerald Ave
- 3322 S Parnell Ave
- 3315 S Lowe Ave
- 3500 S Sangamon St Unit 109
- 3500 S Sangamon St Unit 214
- 604 W 43rd St
- 974 W 35th Place Unit 503
- 917 W 34th Place
- 3246 S Normal Ave
- 3505 S Morgan St Unit P66
- 3505 S Morgan St Unit P75
- 3811 S Parnell Ave
- 3811 S Parnell Ave
- 3811 S Parnell Ave Unit 1
- 523 W 38th St
- 3813 S Parnell Ave
- 519 W 38th St
- 525 W 38th St
- 515 W 38th St
- 3815 S Parnell Ave
- 3817 S Parnell Ave
- 511 W 38th St
- 3819 S Parnell Ave
- 509 W 38th St
- 3821 S Parnell Ave
- 3759 S Parnell Ave Unit 1
- 3759 S Parnell Ave
- 3808 S Normal Ave
- 3810 S Normal Ave
- 3806 S Parnell Ave Unit 2
- 3814 S Normal Ave