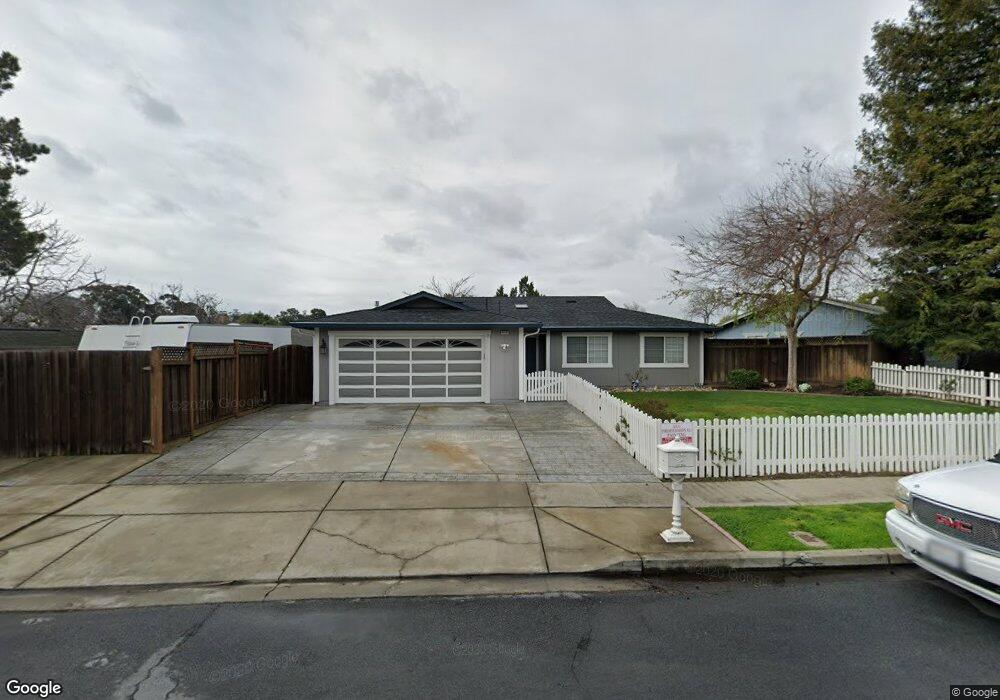
38093 3rd St Fremont, CA 94536
Niles NeighborhoodEstimated Value: $1,030,000 - $1,584,000
3
Beds
2
Baths
1,430
Sq Ft
$929/Sq Ft
Est. Value
About This Home
This home is located at 38093 3rd St, Fremont, CA 94536 and is currently estimated at $1,327,807, approximately $928 per square foot. 38093 3rd St is a home located in Alameda County with nearby schools including Niles Elementary School, Centerville Junior High School, and Washington High School.
Ownership History
Date
Name
Owned For
Owner Type
Purchase Details
Closed on
Nov 12, 1993
Sold by
Alvarado Thomas V and Desalvo Sharon S
Bought by
Guardino Richard J
Current Estimated Value
Home Financials for this Owner
Home Financials are based on the most recent Mortgage that was taken out on this home.
Original Mortgage
$195,500
Outstanding Balance
$70,840
Interest Rate
4.35%
Estimated Equity
$1,256,967
Purchase Details
Closed on
Oct 11, 1993
Sold by
Alvarado Thomas V and Desalvo Sharon S
Bought by
Alvarado Thomas V and Desalvo Sharon S
Home Financials for this Owner
Home Financials are based on the most recent Mortgage that was taken out on this home.
Original Mortgage
$195,500
Outstanding Balance
$70,840
Interest Rate
4.35%
Estimated Equity
$1,256,967
Create a Home Valuation Report for This Property
The Home Valuation Report is an in-depth analysis detailing your home's value as well as a comparison with similar homes in the area
Home Values in the Area
Average Home Value in this Area
Purchase History
| Date | Buyer | Sale Price | Title Company |
|---|---|---|---|
| Guardino Richard J | $217,500 | Northwestern Title Co | |
| Alvarado Thomas V | $49,500 | Northwestern Title Company | |
| Desalvo Sharon S | -- | Northwestern Title Company |
Source: Public Records
Mortgage History
| Date | Status | Borrower | Loan Amount |
|---|---|---|---|
| Open | Guardino Richard J | $195,500 |
Source: Public Records
Tax History Compared to Growth
Tax History
| Year | Tax Paid | Tax Assessment Tax Assessment Total Assessment is a certain percentage of the fair market value that is determined by local assessors to be the total taxable value of land and additions on the property. | Land | Improvement |
|---|---|---|---|---|
| 2025 | $4,885 | $366,008 | $110,983 | $262,025 |
| 2024 | $4,885 | $358,696 | $108,808 | $256,888 |
| 2023 | $4,740 | $358,526 | $106,674 | $251,852 |
| 2022 | $4,660 | $344,496 | $104,583 | $246,913 |
| 2021 | $4,549 | $337,605 | $102,532 | $242,073 |
| 2020 | $4,502 | $341,071 | $101,481 | $239,590 |
| 2019 | $4,453 | $334,384 | $99,491 | $234,893 |
| 2018 | $4,328 | $324,888 | $97,541 | $227,347 |
| 2017 | $4,220 | $318,519 | $95,629 | $222,890 |
| 2016 | $4,138 | $312,275 | $93,754 | $218,521 |
| 2015 | $4,073 | $307,585 | $92,346 | $215,239 |
| 2014 | $3,995 | $301,560 | $90,537 | $211,023 |
Source: Public Records
Map
Nearby Homes
- 38071 3rd St
- 37847 Niles Blvd
- 37915 Vallejo St
- 337 I St
- 118 Sycamore St
- 111 Overacker Terrace
- 38367 Oliver Way
- 38555 Overacker Ave
- 38521 Royal Ann Common
- 22 Sea Crest Terrace
- 711 Old Canyon Rd Unit SPC 33
- 711 Old Canyon Rd Unit 6
- 711 Old Canyon Rd Unit 97
- 711 Old Canyon Rd Unit 77
- 711 Old Canyon Rd Unit 47
- 711 Old Canyon Rd Unit 103
- 711 Old Canyon Rd Unit 56
- 37373 3rd St
- 37230 2nd St
- 38623 Cherry Ln Unit 148