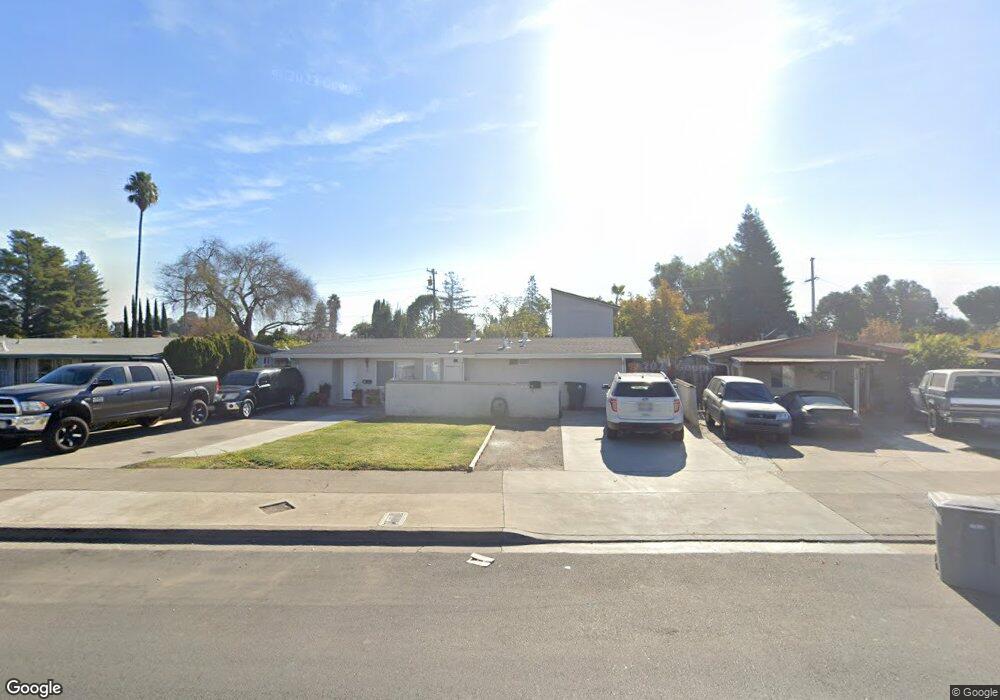
380A I o o f Ave Gilroy, CA 95020
Estimated Value: $806,000 - $948,936
4
Beds
2
Baths
1,325
Sq Ft
$676/Sq Ft
Est. Value
About This Home
This home is located at 380A I o o f Ave, Gilroy, CA 95020 and is currently estimated at $895,984, approximately $676 per square foot. 380A I o o f Ave is a home located in Santa Clara County with nearby schools including Eliot Elementary School, South Valley Middle School, and Brownell Middle School.
Ownership History
Date
Name
Owned For
Owner Type
Purchase Details
Closed on
Sep 13, 2017
Sold by
Serrano Jose N and Serrano Rosa S
Bought by
Serrano Jose N and Serrano Rosa S
Current Estimated Value
Purchase Details
Closed on
Mar 30, 2015
Sold by
Tnhc Hw San Jose Llc
Bought by
Orchard Park Community Association
Purchase Details
Closed on
Feb 6, 2003
Sold by
Alonzo Sally A and Alonzo Estela
Bought by
Serrano Jose N and Serrano Rosa S
Home Financials for this Owner
Home Financials are based on the most recent Mortgage that was taken out on this home.
Original Mortgage
$346,500
Interest Rate
5.76%
Purchase Details
Closed on
Mar 1, 2002
Sold by
Alonzo Sally A
Bought by
Alonzo Sally A and Alonzo Estela
Purchase Details
Closed on
Sep 15, 2000
Sold by
Chris Mendez and Chris Susan E
Bought by
Alonzo Sally A
Home Financials for this Owner
Home Financials are based on the most recent Mortgage that was taken out on this home.
Original Mortgage
$110,000
Interest Rate
8.07%
Create a Home Valuation Report for This Property
The Home Valuation Report is an in-depth analysis detailing your home's value as well as a comparison with similar homes in the area
Home Values in the Area
Average Home Value in this Area
Purchase History
| Date | Buyer | Sale Price | Title Company |
|---|---|---|---|
| Serrano Jose N | -- | None Available | |
| Orchard Park Community Association | -- | First American Title | |
| Serrano Jose N | $385,000 | Commonwealth Land Title | |
| Alonzo Sally A | $70,000 | -- | |
| Alonzo Sally A | $110,000 | North American Title Co |
Source: Public Records
Mortgage History
| Date | Status | Borrower | Loan Amount |
|---|---|---|---|
| Previous Owner | Serrano Jose N | $346,500 | |
| Previous Owner | Alonzo Sally A | $110,000 |
Source: Public Records
Tax History Compared to Growth
Tax History
| Year | Tax Paid | Tax Assessment Tax Assessment Total Assessment is a certain percentage of the fair market value that is determined by local assessors to be the total taxable value of land and additions on the property. | Land | Improvement |
|---|---|---|---|---|
| 2025 | $6,827 | $557,587 | $250,840 | $306,747 |
| 2024 | $6,827 | $546,655 | $245,922 | $300,733 |
| 2023 | $6,787 | $535,937 | $241,100 | $294,837 |
| 2022 | $6,675 | $525,429 | $236,373 | $289,056 |
| 2021 | $6,646 | $515,128 | $231,739 | $283,389 |
| 2020 | $6,573 | $509,847 | $229,363 | $280,484 |
| 2019 | $6,512 | $499,851 | $224,866 | $274,985 |
| 2018 | $6,082 | $490,051 | $220,457 | $269,594 |
| 2017 | $6,210 | $480,443 | $216,135 | $264,308 |
| 2016 | $6,084 | $471,024 | $211,898 | $259,126 |
| 2015 | $5,741 | $463,950 | $208,716 | $255,234 |
| 2014 | $5,705 | $454,863 | $204,628 | $250,235 |
Source: Public Records
Map
Nearby Homes
- 7759 Murray Ave
- 188 Caroline Ln
- 7743 Chestnut St
- 160 Sarafina Way
- 7621 Forest St
- 8282 Murray Ave Unit 99
- 8282 Murray Ave Unit 76
- 332 Lewis St Unit 1/2
- 332 Lewis St
- 8180 Forest St
- 7711 Monterey St
- 7521 Chestnut St
- 8282 Murray #90 Ave Unit 90
- 8340 Forest St
- 7691 Church St Unit B
- 0 Monterey Rd
- 194 4th St
- 1 Poli Rd
- 0 Apn 835-07-018 and Apn 835-07-019 Ave Unit ML82018888
- 0 Dorrance Rd Unit ML82002071