381 Broome St Unit 5 New York, NY 10013
Estimated Value: $1,297,000 - $2,186,687
--
Bed
--
Bath
997
Sq Ft
$1,855/Sq Ft
Est. Value
About This Home
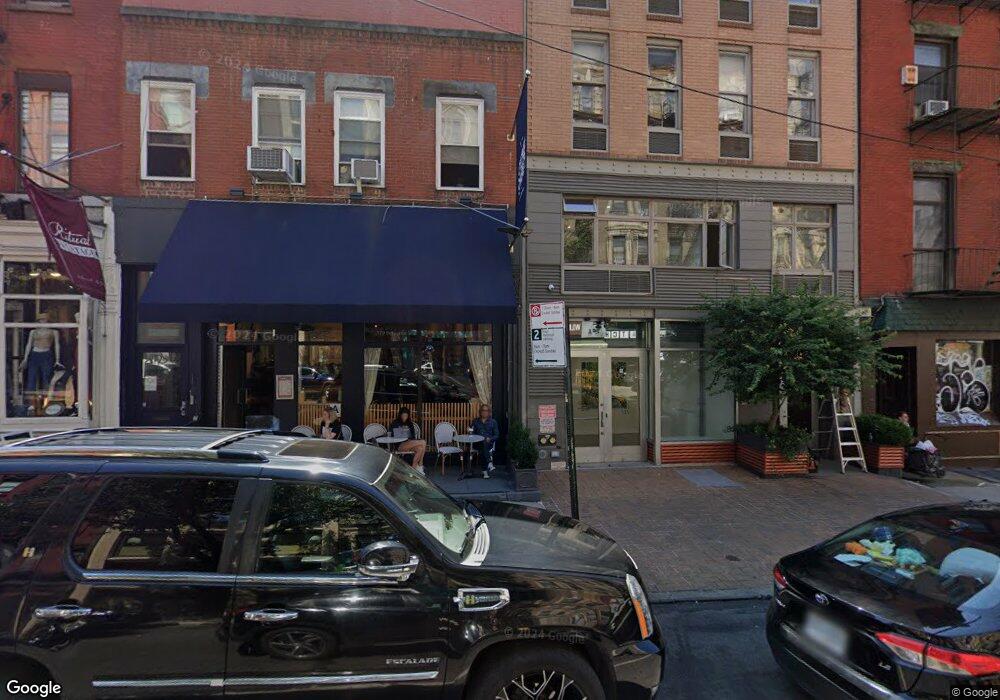
This home is located at 381 Broome St Unit 5, New York, NY 10013 and is currently estimated at $1,849,922, approximately $1,855 per square foot. 381 Broome St Unit 5 is a home located in New York County with nearby schools including P.S. 130 - Hernando De Soto, M.S. 131 Dr. Sun Yat Sen, and Clinton School.
Ownership History
Date
Name
Owned For
Owner Type
Purchase Details
Closed on
Aug 11, 2015
Sold by
Hsu Ricky K and Nash Edward H
Bought by
Edward Nash Revocable Trust Dated 0/ and Edward Nash Trustee
Current Estimated Value
Purchase Details
Closed on
Oct 18, 2007
Sold by
Cong Rong and Kluth Thomas
Bought by
Hsu Ricky and Nash Edward
Home Financials for this Owner
Home Financials are based on the most recent Mortgage that was taken out on this home.
Original Mortgage
$693,537
Interest Rate
6.43%
Mortgage Type
Purchase Money Mortgage
Purchase Details
Closed on
Feb 18, 2004
Sold by
Sophia Partners Llc
Bought by
Cong Rong and Kluth Thomas
Home Financials for this Owner
Home Financials are based on the most recent Mortgage that was taken out on this home.
Original Mortgage
$636,000
Interest Rate
5.6%
Mortgage Type
Purchase Money Mortgage
Create a Home Valuation Report for This Property
The Home Valuation Report is an in-depth analysis detailing your home's value as well as a comparison with similar homes in the area
Home Values in the Area
Average Home Value in this Area
Purchase History
| Date | Buyer | Sale Price | Title Company |
|---|---|---|---|
| Edward Nash Revocable Trust Dated 0/ | -- | -- | |
| Hsu Ricky | $1,300,000 | -- | |
| Hsu Ricky | $1,300,000 | -- | |
| Cong Rong | $809,509 | -- | |
| Cong Rong | $809,509 | -- |
Source: Public Records
Mortgage History
| Date | Status | Borrower | Loan Amount |
|---|---|---|---|
| Previous Owner | Hsu Ricky | $693,537 | |
| Previous Owner | Cong Rong | $636,000 |
Source: Public Records
Tax History Compared to Growth
Tax History
| Year | Tax Paid | Tax Assessment Tax Assessment Total Assessment is a certain percentage of the fair market value that is determined by local assessors to be the total taxable value of land and additions on the property. | Land | Improvement |
|---|---|---|---|---|
| 2025 | $27,121 | $221,584 | $7,003 | $214,581 |
| 2024 | $27,121 | $216,937 | $10,175 | $210,849 |
| 2023 | $24,640 | $200,868 | $6,764 | $194,104 |
| 2022 | $18,774 | $327,308 | $10,175 | $317,133 |
| 2021 | $21,125 | $261,807 | $10,175 | $251,632 |
| 2020 | $17,721 | $275,047 | $10,175 | $264,872 |
| 2019 | $17,363 | $282,456 | $10,175 | $272,281 |
| 2018 | $19,653 | $154,514 | $6,192 | $148,322 |
| 2017 | $17,907 | $143,069 | $6,484 | $136,585 |
| 2016 | $16,774 | $132,472 | $6,619 | $125,853 |
| 2015 | $7,048 | $132,472 | $7,235 | $125,237 |
| 2014 | $7,048 | $128,366 | $5,936 | $122,430 |
Source: Public Records
Map
Nearby Homes
- 185 Grand St Unit 6 C
- 185 Grand St Unit 2B
- 133 Mulberry St Unit 4C
- 240 Centre St Unit 3J
- 240 Centre St Unit 2K
- 240 Centre St Unit 3-B
- 354 Broome St Unit 3I
- 152 Elizabeth St Unit PH
- 75 Kenmare St Unit 2J
- 75 Kenmare St Unit PHC
- 75 Kenmare St Unit 6D
- 75 Kenmare St Unit 4E
- 75 Kenmare St Unit 5E
- 75 Kenmare St Unit 4D
- 165 Elizabeth St Unit 4R
- 53 Elizabeth St Unit 4-A
- 225 Lafayette St Unit 10A
- 123 Baxter St Unit PHB
- 141 Grand St
- 210 Lafayette St Unit 4B
- 381 Broome St
- 381 Broome St Unit 6F
- 381 Broome St Unit 4
- 381 Broome St Unit 3
- 381 Broome St Unit 2F
- 381 Broome St Unit 1
- 383 Broome St
- 176 Mulberry St
- 176 Mulberry St Unit 5
- 176 Mulberry St Unit 3
- 176 Mulberry St Unit 1
- 176 Mulberry St Unit 2
- 176 Mulberry St Unit 2NDFLOOR
- 176 Mulberry St Unit Penthouse
- 176 Mulberry St Unit PH
- 379 Broome St Unit Ground
- 379 Broome St Unit 2R
- 379 Broome St
- 377 Broome St Unit 16
- 377 Broome St Unit 3