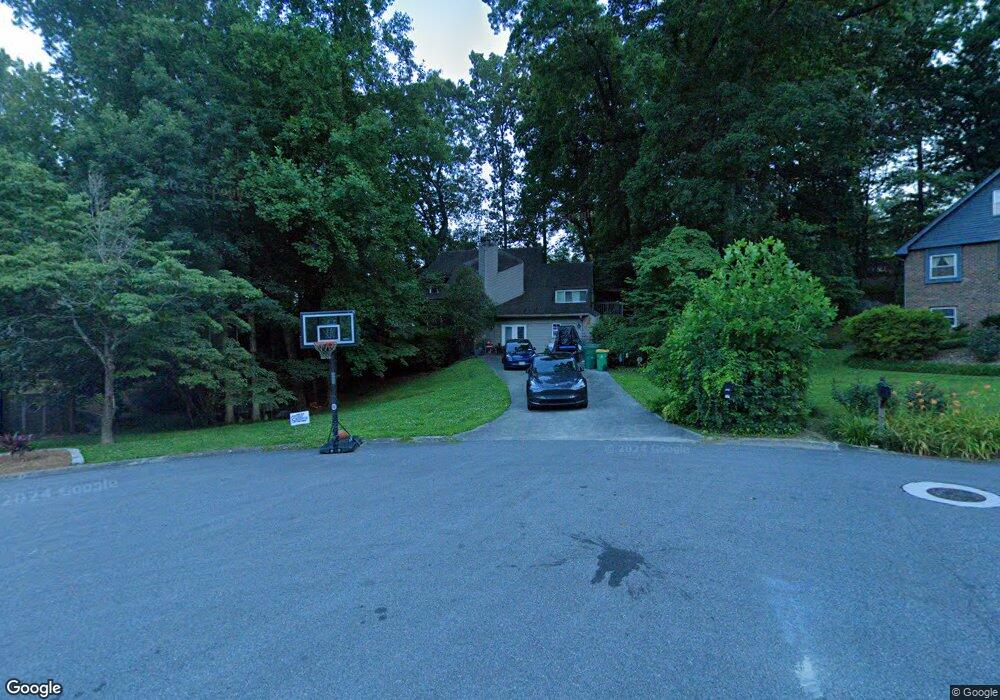
381 Clear Spring Ct Unit 3 Marietta, GA 30068
Estimated Value: $390,000 - $513,000
4
Beds
3
Baths
2,154
Sq Ft
$219/Sq Ft
Est. Value
About This Home
This home is located at 381 Clear Spring Ct Unit 3, Marietta, GA 30068 and is currently estimated at $471,993, approximately $219 per square foot. 381 Clear Spring Ct Unit 3 is a home located in Cobb County with nearby schools including Sedalia Park Elementary School, East Cobb Middle School, and Wheeler High School.
Ownership History
Date
Name
Owned For
Owner Type
Purchase Details
Closed on
Aug 22, 2012
Sold by
Garner Roy
Bought by
Garner Roy and Garner Mary Elizabeth
Current Estimated Value
Purchase Details
Closed on
May 18, 2012
Sold by
Fraser Philippus D
Bought by
Garner Roy
Purchase Details
Closed on
Nov 13, 2000
Sold by
Reichmuth John E
Bought by
Arceneaux Kimberly B
Home Financials for this Owner
Home Financials are based on the most recent Mortgage that was taken out on this home.
Original Mortgage
$159,200
Interest Rate
7.82%
Mortgage Type
New Conventional
Purchase Details
Closed on
Feb 13, 1998
Sold by
Thurman Barbara J
Bought by
Reichmuth John E
Home Financials for this Owner
Home Financials are based on the most recent Mortgage that was taken out on this home.
Original Mortgage
$161,100
Interest Rate
7.07%
Mortgage Type
New Conventional
Create a Home Valuation Report for This Property
The Home Valuation Report is an in-depth analysis detailing your home's value as well as a comparison with similar homes in the area
Home Values in the Area
Average Home Value in this Area
Purchase History
| Date | Buyer | Sale Price | Title Company |
|---|---|---|---|
| Garner Roy | $102,490 | -- | |
| Garner Roy | $102,490 | -- | |
| Arceneaux Kimberly B | $199,000 | -- | |
| Reichmuth John E | $169,700 | -- |
Source: Public Records
Mortgage History
| Date | Status | Borrower | Loan Amount |
|---|---|---|---|
| Previous Owner | Arceneaux Kimberly B | $159,200 | |
| Previous Owner | Reichmuth John E | $161,100 |
Source: Public Records
Tax History Compared to Growth
Tax History
| Year | Tax Paid | Tax Assessment Tax Assessment Total Assessment is a certain percentage of the fair market value that is determined by local assessors to be the total taxable value of land and additions on the property. | Land | Improvement |
|---|---|---|---|---|
| 2024 | $4,029 | $163,752 | $56,000 | $107,752 |
| 2023 | $2,907 | $137,040 | $44,000 | $93,040 |
| 2022 | $3,433 | $135,148 | $44,000 | $91,148 |
| 2021 | $3,280 | $128,124 | $44,000 | $84,124 |
| 2020 | $3,280 | $128,124 | $44,000 | $84,124 |
| 2019 | $3,280 | $128,124 | $44,000 | $84,124 |
| 2018 | $3,160 | $122,672 | $30,000 | $92,672 |
| 2017 | $3,039 | $122,672 | $30,000 | $92,672 |
| 2016 | $2,544 | $100,080 | $30,000 | $70,080 |
| 2015 | $2,605 | $100,080 | $30,000 | $70,080 |
| 2014 | $955 | $40,972 | $0 | $0 |
Source: Public Records
Map
Nearby Homes
- 361 Clear Spring Ct
- 310 Clear Spring Ct
- 507 Spring Creek Way NE Unit 2
- 2377 Emory Ln NE
- 478 Guilford Cir
- 53 Weatherstone Pkwy
- 57 Sewell Ln
- 2431 Weatherford Ct
- 2451 Old Sewell Rd Unit 1
- 20 Ashton Woods Dr
- 2310 Old Sewell Rd
- 2164 Pawnee Dr SE Unit 1
- 1821 Clearwater Dr SE
- 332 Hamilton Trace
- 190 Kenley Ct
- 774 Mary Ann Dr NE
- 11 Cecil Dr
- 2265 Fremont Dr
- 2235 Old Orchard Dr
- 380 Clear Spring Ct Unit 3
- 2225 Old Orchard Dr Unit 3
- 2245 Old Orchard Dr Unit 4
- 370 Willow Glen Ct Unit 3
- 370 Clear Spring Ct Unit 3
- 360 Willow Glen Ct Unit 3
- 2215 Old Orchard Dr
- 2255 Old Orchard Dr
- 360 Clear Spring Ct Unit 3
- 351 Clear Spring Ct
- 351 Clear Springs Ct
- 2205 Old Orchard Dr
- 0 Old Orchard Dr Unit 7477511
- 0 Old Orchard Dr Unit 7268393
- 0 Old Orchard Dr Unit 7162182
- 0 Old Orchard Dr Unit 7101096
- 0 Old Orchard Dr Unit 7076347
- 0 Old Orchard Dr Unit 3281478
- 0 Old Orchard Dr Unit 3275739