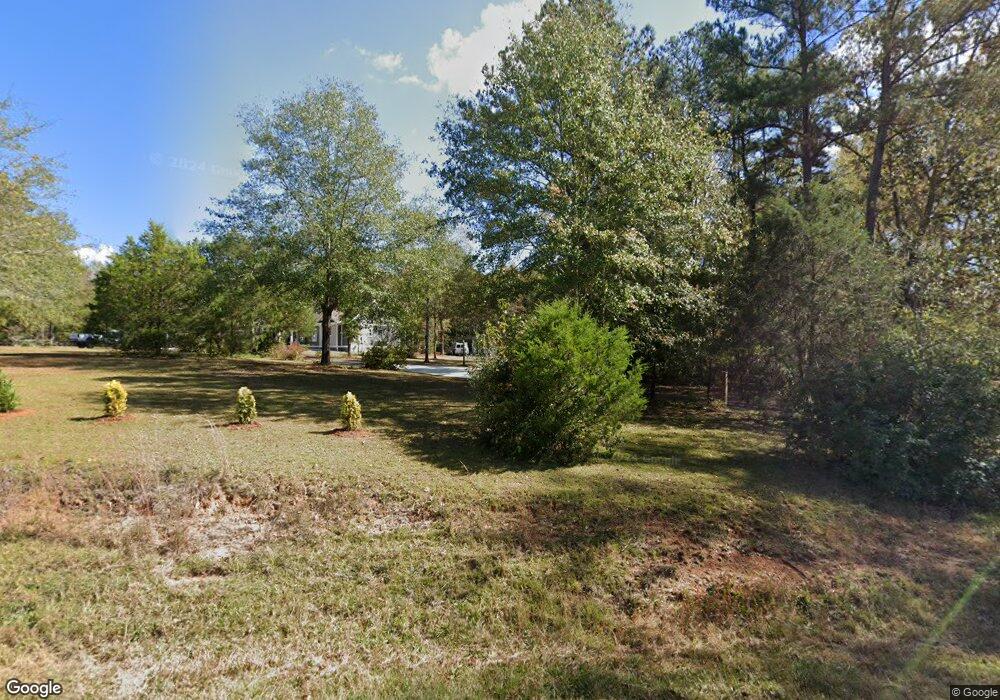
381 Fling Rd Lagrange, GA 30240
Estimated Value: $233,000 - $510,590
3
Beds
2
Baths
1,762
Sq Ft
$193/Sq Ft
Est. Value
About This Home
This home is located at 381 Fling Rd, Lagrange, GA 30240 and is currently estimated at $339,530, approximately $192 per square foot. 381 Fling Rd is a home located in Troup County with nearby schools including Berta Weathersbee Elementary School, Long Cane Elementary School, and Whitesville Road Elementary School.
Ownership History
Date
Name
Owned For
Owner Type
Purchase Details
Closed on
Nov 7, 2019
Sold by
Fedusiv Stefan
Bought by
Maddox Ashley and Maddox Wanda Marlene
Current Estimated Value
Purchase Details
Closed on
Apr 17, 2006
Sold by
Oneal Billy E
Bought by
Fedusiv Stefan
Home Financials for this Owner
Home Financials are based on the most recent Mortgage that was taken out on this home.
Original Mortgage
$91,920
Interest Rate
6.38%
Mortgage Type
New Conventional
Purchase Details
Closed on
Jan 16, 1990
Sold by
John Preston Heard
Bought by
Danny Thomas E and Danny O'Neal
Purchase Details
Closed on
Aug 1, 1986
Sold by
Flora Heard
Bought by
John Preston Heard
Purchase Details
Closed on
May 10, 1984
Sold by
Heard?
Bought by
Flora Heard
Purchase Details
Closed on
Jan 1, 1949
Sold by
Meadors Darden H and Meadors Jason L
Bought by
Heard?
Create a Home Valuation Report for This Property
The Home Valuation Report is an in-depth analysis detailing your home's value as well as a comparison with similar homes in the area
Home Values in the Area
Average Home Value in this Area
Purchase History
| Date | Buyer | Sale Price | Title Company |
|---|---|---|---|
| Maddox Ashley | $45,000 | -- | |
| Fedusiv Stefan | $114,900 | -- | |
| Danny Thomas E | $65,000 | -- | |
| John Preston Heard | -- | -- | |
| Flora Heard | -- | -- | |
| Heard? | -- | -- |
Source: Public Records
Mortgage History
| Date | Status | Borrower | Loan Amount |
|---|---|---|---|
| Previous Owner | Fedusiv Stefan | $91,920 |
Source: Public Records
Tax History Compared to Growth
Tax History
| Year | Tax Paid | Tax Assessment Tax Assessment Total Assessment is a certain percentage of the fair market value that is determined by local assessors to be the total taxable value of land and additions on the property. | Land | Improvement |
|---|---|---|---|---|
| 2024 | $4,547 | $168,720 | $17,600 | $151,120 |
| 2023 | $4,026 | $1,700 | $0 | $1,700 |
| 2022 | $4,392 | $157,360 | $17,600 | $139,760 |
| 2021 | $2,246 | $74,480 | $17,600 | $56,880 |
| 2020 | $531 | $17,600 | $17,600 | $0 |
| 2019 | $300 | $9,960 | $9,960 | $0 |
| 2018 | $300 | $9,960 | $9,960 | $0 |
| 2017 | $300 | $9,960 | $9,960 | $0 |
| 2016 | $331 | $10,964 | $9,974 | $990 |
| 2015 | $331 | $10,964 | $9,974 | $990 |
| 2014 | $330 | $10,912 | $9,974 | $938 |
| 2013 | -- | $10,860 | $9,974 | $886 |
Source: Public Records
Map
Nearby Homes
- 37 Overbrook Dr
- 509 Connie Dr
- 0 Bradfield Dr Unit 10568803
- 808 S Fling Rd
- 190 Hill Rd
- 146 Whitaker Rd
- 141 Avery Dr
- 124 Foxdale Dr
- 110 Hawthorne Cir
- 103 Hawthorne Cir
- 105 Hawthorne Cir
- 223 Pinehaven Dr
- 117 Brookwood Dr
- 0 Unit 10514554
- 100 Huntcliff Ct
- 61 Freeman Rd
- 22 Freeman Rd
- 104 Spring Valley Dr
- LOT 4 Angela Dr
- E Angela Dr