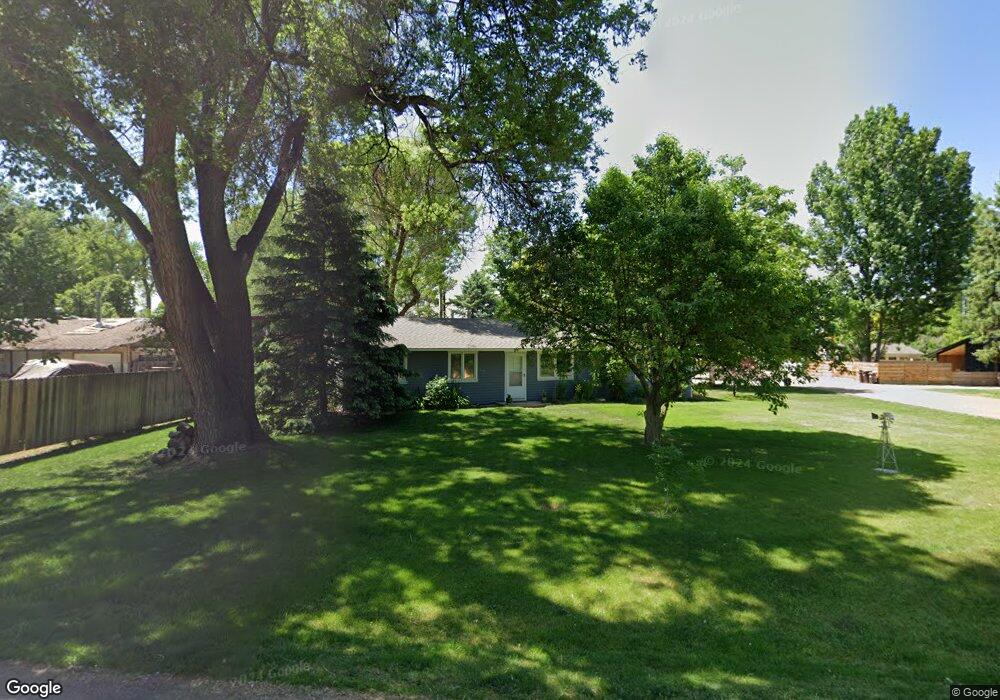
381 Franklin St Niwot, CO 80503
Niwot NeighborhoodEstimated Value: $723,675 - $921,000
4
Beds
2
Baths
1,550
Sq Ft
$520/Sq Ft
Est. Value
About This Home
This home is located at 381 Franklin St, Niwot, CO 80503 and is currently estimated at $806,669, approximately $520 per square foot. 381 Franklin St is a home located in Boulder County with nearby schools including Niwot Elementary School, Sunset Middle School, and Niwot High School.
Ownership History
Date
Name
Owned For
Owner Type
Purchase Details
Closed on
Jul 17, 2009
Sold by
Pildner Philip and Pildner Julie S
Bought by
Valdez Thomas P
Current Estimated Value
Home Financials for this Owner
Home Financials are based on the most recent Mortgage that was taken out on this home.
Original Mortgage
$310,000
Outstanding Balance
$203,147
Interest Rate
5.39%
Mortgage Type
Unknown
Estimated Equity
$603,522
Purchase Details
Closed on
Aug 5, 2005
Sold by
Pildner Philip and Snyder Julie L
Bought by
Pildner Philip
Home Financials for this Owner
Home Financials are based on the most recent Mortgage that was taken out on this home.
Original Mortgage
$250,000
Interest Rate
5.51%
Mortgage Type
Credit Line Revolving
Purchase Details
Closed on
Feb 1, 1999
Sold by
Lacey Eve E
Bought by
Pildner Philip
Purchase Details
Closed on
Nov 21, 1990
Bought by
Valdez Thomas P
Purchase Details
Closed on
Sep 12, 1985
Bought by
Valdez Thomas P
Create a Home Valuation Report for This Property
The Home Valuation Report is an in-depth analysis detailing your home's value as well as a comparison with similar homes in the area
Home Values in the Area
Average Home Value in this Area
Purchase History
| Date | Buyer | Sale Price | Title Company |
|---|---|---|---|
| Valdez Thomas P | $365,000 | Land Title Guarantee Company | |
| Pildner Philip | -- | -- | |
| Pildner Philip | $160,000 | Land Title | |
| Valdez Thomas P | $68,000 | -- | |
| Valdez Thomas P | -- | -- | |
| Valdez Thomas P | -- | -- |
Source: Public Records
Mortgage History
| Date | Status | Borrower | Loan Amount |
|---|---|---|---|
| Open | Valdez Thomas P | $310,000 | |
| Previous Owner | Pildner Philip | $250,000 |
Source: Public Records
Tax History Compared to Growth
Tax History
| Year | Tax Paid | Tax Assessment Tax Assessment Total Assessment is a certain percentage of the fair market value that is determined by local assessors to be the total taxable value of land and additions on the property. | Land | Improvement |
|---|---|---|---|---|
| 2025 | $4,280 | $45,844 | $20,700 | $25,144 |
| 2024 | $4,280 | $45,844 | $20,700 | $25,144 |
| 2023 | $4,223 | $43,121 | $19,175 | $27,631 |
| 2022 | $3,904 | $38,031 | $17,278 | $20,753 |
| 2021 | $3,956 | $39,125 | $17,775 | $21,350 |
| 2020 | $3,673 | $36,408 | $7,508 | $28,900 |
| 2019 | $3,614 | $36,408 | $7,508 | $28,900 |
| 2018 | $2,944 | $29,794 | $6,912 | $22,882 |
| 2017 | $2,772 | $32,939 | $7,642 | $25,297 |
| 2016 | $2,807 | $29,556 | $7,642 | $21,914 |
| 2015 | $2,674 | $26,666 | $8,438 | $18,228 |
| 2014 | $2,476 | $26,666 | $8,438 | $18,228 |
Source: Public Records
Map
Nearby Homes
- 8076 Meadowdale Square
- 8050 Niwot Rd Unit 1
- 8050 Niwot Rd Unit 28
- 8050 Niwot Rd Unit 40
- 8060 Niwot Rd Unit 66E
- 8060 Niwot Rd Unit 34
- 8180 Dry Creek Cir
- 7284 Dry Creek Rd
- 7464 Whirlaway Ln
- 8400 Sawtooth Ln
- 8461 Pawnee Ln
- 3625 Nimbus Rd
- 8020 N 81st St
- 7204 Spring Creek Cir
- 8748 Skyland Dr
- 6789 Niwot Rd
- 8896 Niwot Rd
- 6541 Legend Ridge Trail
- 6771 Niwot Hills Dr
- 7466 Park Lane Rd