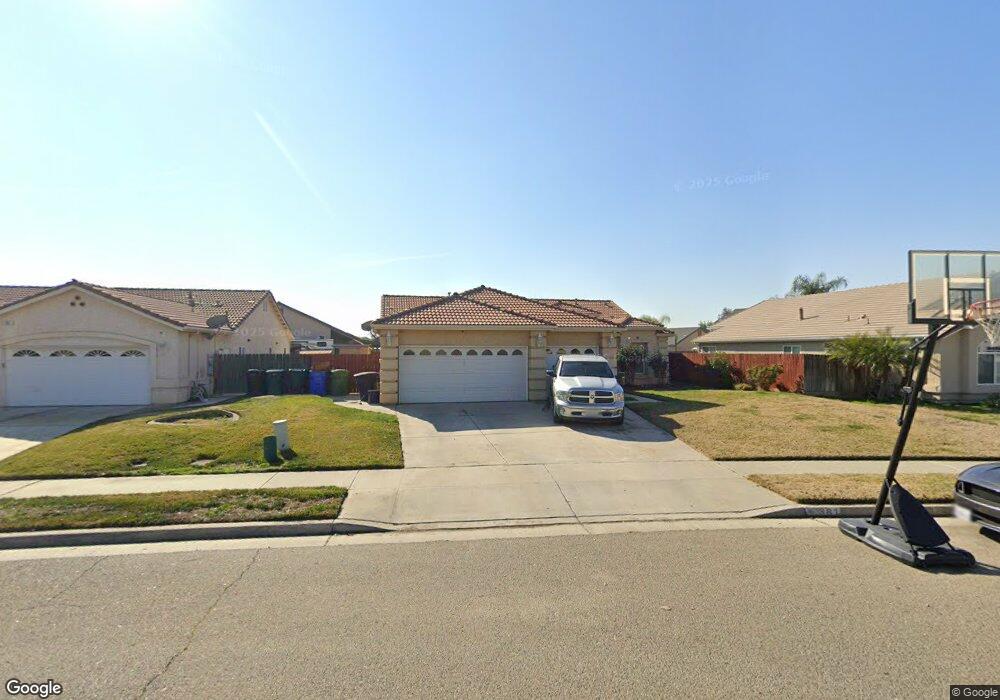
381 Hillcrest St Lemoore, CA 93245
Estimated Value: $414,453 - $458,000
3
Beds
2
Baths
2,142
Sq Ft
$204/Sq Ft
Est. Value
About This Home
This home is located at 381 Hillcrest St, Lemoore, CA 93245 and is currently estimated at $436,363, approximately $203 per square foot. 381 Hillcrest St is a home located in Kings County with nearby schools including P.W. Engvall Elementary School, Liberty Middle School, and Lemoore High School.
Ownership History
Date
Name
Owned For
Owner Type
Purchase Details
Closed on
May 30, 2013
Sold by
Fairway Homes
Bought by
Cedar Nest Homes
Current Estimated Value
Home Financials for this Owner
Home Financials are based on the most recent Mortgage that was taken out on this home.
Original Mortgage
$229,837
Outstanding Balance
$161,689
Interest Rate
3.32%
Mortgage Type
VA
Estimated Equity
$274,674
Purchase Details
Closed on
May 20, 2013
Sold by
Cedar Nest Homes
Bought by
Martinez Joseph A and Martinez Kristine S
Home Financials for this Owner
Home Financials are based on the most recent Mortgage that was taken out on this home.
Original Mortgage
$229,837
Outstanding Balance
$161,689
Interest Rate
3.32%
Mortgage Type
VA
Estimated Equity
$274,674
Create a Home Valuation Report for This Property
The Home Valuation Report is an in-depth analysis detailing your home's value as well as a comparison with similar homes in the area
Home Values in the Area
Average Home Value in this Area
Purchase History
| Date | Buyer | Sale Price | Title Company |
|---|---|---|---|
| Cedar Nest Homes | -- | Chicago Title Company | |
| Martinez Joseph A | $225,000 | Chicago Title Company |
Source: Public Records
Mortgage History
| Date | Status | Borrower | Loan Amount |
|---|---|---|---|
| Open | Martinez Joseph A | $229,837 |
Source: Public Records
Tax History
| Year | Tax Paid | Tax Assessment Tax Assessment Total Assessment is a certain percentage of the fair market value that is determined by local assessors to be the total taxable value of land and additions on the property. | Land | Improvement |
|---|---|---|---|---|
| 2025 | $2,959 | $277,068 | $73,884 | $203,184 |
| 2023 | $2,959 | $266,311 | $71,016 | $195,295 |
| 2022 | $3,089 | $261,090 | $69,624 | $191,466 |
| 2021 | $3,011 | $255,971 | $68,259 | $187,712 |
| 2020 | $2,987 | $253,346 | $67,559 | $185,787 |
| 2019 | $2,961 | $248,378 | $66,234 | $182,144 |
| 2018 | $2,789 | $243,508 | $64,935 | $178,573 |
| 2017 | $2,792 | $238,734 | $63,662 | $175,072 |
| 2016 | $2,622 | $234,053 | $62,414 | $171,639 |
| 2015 | $2,611 | $230,537 | $61,476 | $169,061 |
| 2014 | $2,539 | $226,021 | $60,272 | $165,749 |
Source: Public Records
Map
Nearby Homes