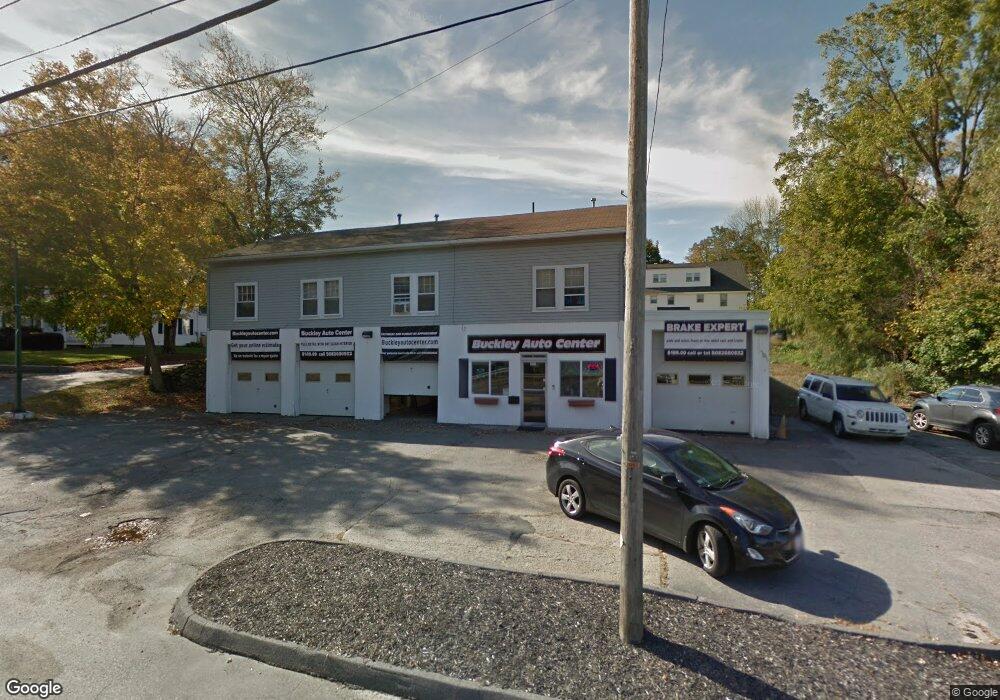
381 Main St Unit 1 Oxford, MA 01540
Estimated Value: $547,700
6
Beds
2
Baths
1,500
Sq Ft
$365/Sq Ft
Est. Value
About This Home
This home is located at 381 Main St Unit 1, Oxford, MA 01540 and is currently estimated at $547,700, approximately $365 per square foot. 381 Main St Unit 1 is a home located in Worcester County with nearby schools including Alfred M Chaffee, Oxford High School, and Clara Barton Elementary School.
Ownership History
Date
Name
Owned For
Owner Type
Purchase Details
Closed on
Jun 4, 2024
Sold by
Chen Michael
Bought by
Elite Prop Grp Oxford Llc
Current Estimated Value
Purchase Details
Closed on
Feb 17, 2005
Sold by
Front Street Rt and Tuite
Bought by
Cj Ox Llc
Home Financials for this Owner
Home Financials are based on the most recent Mortgage that was taken out on this home.
Original Mortgage
$500,000
Interest Rate
5.78%
Mortgage Type
Commercial
Purchase Details
Closed on
Jul 15, 1999
Sold by
Flagg Wilfred F
Bought by
Oxford Sunshine Proper
Create a Home Valuation Report for This Property
The Home Valuation Report is an in-depth analysis detailing your home's value as well as a comparison with similar homes in the area
Home Values in the Area
Average Home Value in this Area
Purchase History
| Date | Buyer | Sale Price | Title Company |
|---|---|---|---|
| Elite Prop Grp Oxford Llc | -- | None Available | |
| Elite Prop Grp Oxford Llc | -- | None Available | |
| Cj Ox Llc | $100,000 | -- | |
| Cj Ox Llc | $100,000 | -- | |
| Oxford Sunshine Proper | $25,000 | -- | |
| Oxford Sunshine Proper | $25,000 | -- |
Source: Public Records
Mortgage History
| Date | Status | Borrower | Loan Amount |
|---|---|---|---|
| Previous Owner | Oxford Sunshine Proper | $0 | |
| Previous Owner | Cj Ox Llc | $500,000 |
Source: Public Records
Tax History Compared to Growth
Tax History
| Year | Tax Paid | Tax Assessment Tax Assessment Total Assessment is a certain percentage of the fair market value that is determined by local assessors to be the total taxable value of land and additions on the property. | Land | Improvement |
|---|---|---|---|---|
| 2025 | $0 | $475,400 | $149,400 | $326,000 |
| 2024 | $5,802 | $430,400 | $149,400 | $281,000 |
| 2023 | $5,693 | $417,400 | $145,000 | $272,400 |
| 2022 | $5,688 | $352,000 | $120,800 | $231,200 |
| 2021 | $5,435 | $328,800 | $120,800 | $208,000 |
| 2020 | $5,286 | $317,300 | $120,800 | $196,500 |
| 2019 | $4,651 | $273,100 | $104,700 | $168,400 |
| 2018 | $4,428 | $256,400 | $104,700 | $151,700 |
| 2017 | $4,199 | $249,200 | $98,600 | $150,600 |
| 2016 | $4,219 | $249,200 | $98,600 | $150,600 |
| 2015 | $3,935 | $249,200 | $98,600 | $150,600 |
| 2014 | $3,474 | $231,600 | $91,100 | $140,500 |
Source: Public Records
Map
Nearby Homes