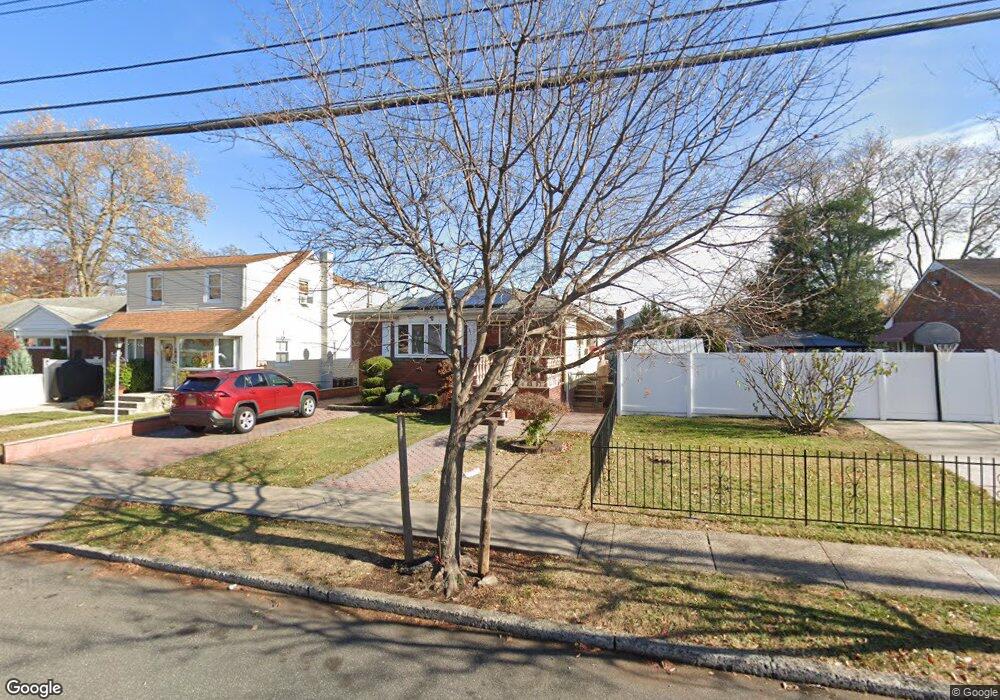
381 Stewart Ave Staten Island, NY 10314
Westerleigh NeighborhoodEstimated Value: $710,000 - $763,000
3
Beds
2
Baths
1,144
Sq Ft
$642/Sq Ft
Est. Value
About This Home
This home is located at 381 Stewart Ave, Staten Island, NY 10314 and is currently estimated at $734,959, approximately $642 per square foot. 381 Stewart Ave is a home located in Richmond County with nearby schools including P.S. 30 Westerleigh, I.S. 51 Edwin Markham, and Port Richmond High School.
Ownership History
Date
Name
Owned For
Owner Type
Purchase Details
Closed on
Feb 1, 2024
Sold by
Varghese Sebastian Family Irrevocable Re
Bought by
Rose Rohin Aloysius and Rose Joseph Aloysius
Current Estimated Value
Home Financials for this Owner
Home Financials are based on the most recent Mortgage that was taken out on this home.
Original Mortgage
$560,000
Outstanding Balance
$550,122
Interest Rate
6.62%
Mortgage Type
New Conventional
Estimated Equity
$184,837
Purchase Details
Closed on
Dec 9, 2022
Sold by
Varghese Sebastian and Varghese Mercy
Bought by
Varghese Sebastian Family Irrevocable Residen
Purchase Details
Closed on
Dec 19, 1997
Sold by
Andruzzi Louis and Andruzzi Ralph
Bought by
Varghese Sebastian and Sebastian Mercy
Home Financials for this Owner
Home Financials are based on the most recent Mortgage that was taken out on this home.
Original Mortgage
$100,000
Interest Rate
7.15%
Purchase Details
Closed on
Apr 29, 1996
Sold by
Andruzzi Henrietta
Bought by
Andruzzi Louis and Andruzzi Ralph
Create a Home Valuation Report for This Property
The Home Valuation Report is an in-depth analysis detailing your home's value as well as a comparison with similar homes in the area
Home Values in the Area
Average Home Value in this Area
Purchase History
| Date | Buyer | Sale Price | Title Company |
|---|---|---|---|
| Rose Rohin Aloysius | $700,000 | Old Republic National Title | |
| Varghese Sebastian Family Irrevocable Residen | -- | -- | |
| Varghese Sebastian | $205,000 | -- | |
| Andruzzi Louis | -- | -- |
Source: Public Records
Mortgage History
| Date | Status | Borrower | Loan Amount |
|---|---|---|---|
| Open | Rose Rohin Aloysius | $560,000 | |
| Previous Owner | Varghese Sebastian | $100,000 |
Source: Public Records
Tax History Compared to Growth
Tax History
| Year | Tax Paid | Tax Assessment Tax Assessment Total Assessment is a certain percentage of the fair market value that is determined by local assessors to be the total taxable value of land and additions on the property. | Land | Improvement |
|---|---|---|---|---|
| 2025 | $5,770 | $44,580 | $9,628 | $34,952 |
| 2024 | $6,052 | $39,780 | $10,180 | $29,600 |
| 2023 | $5,489 | $28,426 | $9,518 | $18,908 |
| 2022 | $5,388 | $37,200 | $13,440 | $23,760 |
| 2021 | $5,634 | $39,180 | $13,440 | $25,740 |
| 2020 | $5,337 | $34,500 | $13,440 | $21,060 |
| 2019 | $4,960 | $35,880 | $13,440 | $22,440 |
| 2018 | $4,531 | $23,688 | $10,741 | $12,947 |
| 2017 | $4,529 | $23,688 | $11,560 | $12,128 |
| 2016 | $4,390 | $23,509 | $12,050 | $11,459 |
| 2015 | $3,711 | $22,179 | $13,981 | $8,198 |
| 2014 | $3,711 | $20,924 | $13,893 | $7,031 |
Source: Public Records
Map
Nearby Homes
- 255 Caswell Ave
- 279 Collfield Ave
- 320 Bryson Ave
- 22 Francine Ln
- 13 Hawthorne Ave
- 422 Crystal Ave
- 181 Collfield Ave
- 360 Caswell Ave
- 182 Woodbine Ave
- 124 Woodbine Ave
- 493 Willowbrook Rd
- 144 Bryson Ave
- 379 Woolley Ave
- 2437 Victory Blvd
- 2439 Victory Blvd
- 2441 Victory Blvd
- 522 Stewart Ave
- 292 Woolley Ave
- 470 Livermore Ave
- 290 Woolley Ave
- 375 Stewart Ave
- 387 Stewart Ave
- 371 Stewart Ave
- 274 Bryson Ave
- 280 Bryson Ave
- 268 Bryson Ave
- 369 Stewart Ave
- 264 Bryson Ave
- 275 Caswell Ave
- 286 Bryson Ave
- 376 Stewart Ave
- 260 Bryson Ave
- 372 Stewart Ave
- 357 Stewart Ave
- 279 Caswell Ave
- 366 Stewart Ave
- 256 Bryson Ave
- 360 Stewart Ave
- 353 Stewart Ave
- 283 Caswell Ave