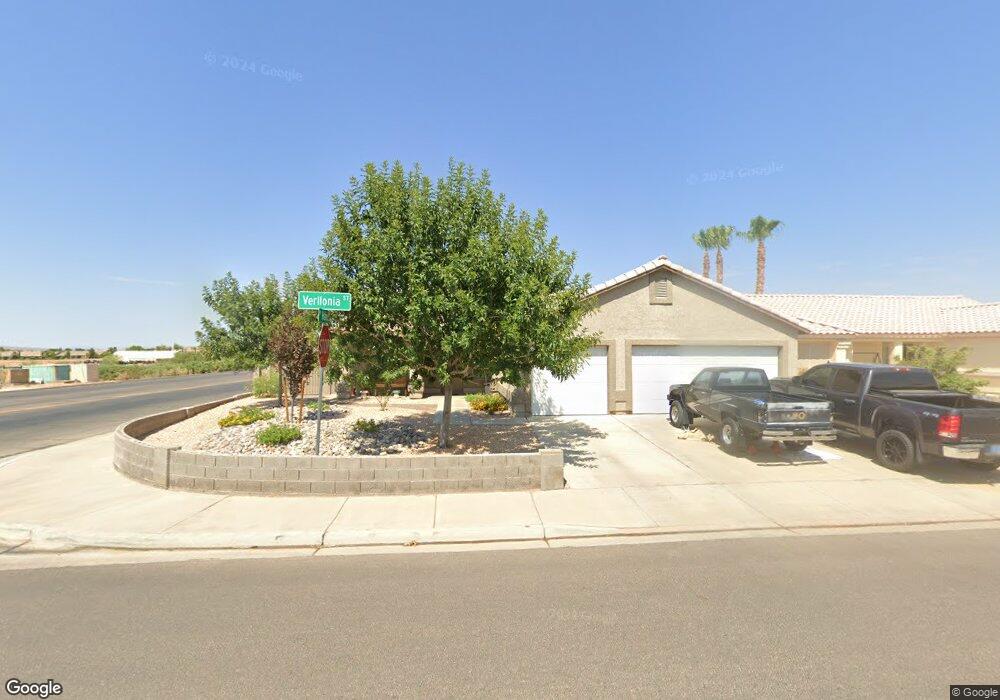
381 Verllonia St Mesquite, NV 89027
Estimated Value: $369,994 - $466,000
4
Beds
2
Baths
1,610
Sq Ft
$250/Sq Ft
Est. Value
About This Home
This home is located at 381 Verllonia St, Mesquite, NV 89027 and is currently estimated at $402,499, approximately $249 per square foot. 381 Verllonia St is a home located in Clark County with nearby schools including Virgin Valley Elementary School, Charles Arthur Hughes Middle School, and Virgin Valley High School.
Ownership History
Date
Name
Owned For
Owner Type
Purchase Details
Closed on
Nov 19, 2007
Sold by
Hafen Gary B and Hafen Monta
Bought by
Hafen Bret M
Current Estimated Value
Purchase Details
Closed on
Dec 28, 2005
Sold by
Hafen Bryan K and Hafen Dawn N
Bought by
Hafen Gary B and Hafen Monta
Purchase Details
Closed on
Jun 13, 2005
Sold by
Zmh Development Inc
Bought by
The G & M Hafen 1994 Trust
Purchase Details
Closed on
May 10, 2005
Sold by
Hafen Gary B and Hafen Monta
Bought by
Coyote Willows Golf Llc
Purchase Details
Closed on
Jun 25, 1997
Sold by
Dane William N
Bought by
Hafen Gary B and Hafen Monta
Home Financials for this Owner
Home Financials are based on the most recent Mortgage that was taken out on this home.
Original Mortgage
$95,200
Interest Rate
7.91%
Create a Home Valuation Report for This Property
The Home Valuation Report is an in-depth analysis detailing your home's value as well as a comparison with similar homes in the area
Home Values in the Area
Average Home Value in this Area
Purchase History
| Date | Buyer | Sale Price | Title Company |
|---|---|---|---|
| Hafen Bret M | -- | None Available | |
| Hafen Gary B | -- | None Available | |
| The G & M Hafen 1994 Trust | -- | -- | |
| Coyote Willows Golf Llc | -- | -- | |
| Hafen Gary B | $120,500 | Fidelity National Title |
Source: Public Records
Mortgage History
| Date | Status | Borrower | Loan Amount |
|---|---|---|---|
| Previous Owner | Hafen Gary B | $95,200 |
Source: Public Records
Tax History Compared to Growth
Tax History
| Year | Tax Paid | Tax Assessment Tax Assessment Total Assessment is a certain percentage of the fair market value that is determined by local assessors to be the total taxable value of land and additions on the property. | Land | Improvement |
|---|---|---|---|---|
| 2025 | $1,575 | $91,862 | $26,075 | $65,787 |
| 2024 | $1,530 | $91,862 | $26,075 | $65,787 |
| 2023 | $1,530 | $87,900 | $25,200 | $62,700 |
| 2022 | $1,485 | $78,368 | $21,000 | $57,368 |
| 2021 | $1,442 | $72,171 | $17,500 | $54,671 |
| 2020 | $1,398 | $69,551 | $15,400 | $54,151 |
| 2019 | $1,357 | $68,895 | $15,400 | $53,495 |
| 2018 | $1,318 | $64,691 | $12,950 | $51,741 |
| 2017 | $1,797 | $64,790 | $12,250 | $52,540 |
| 2016 | $1,247 | $58,419 | $9,800 | $48,619 |
| 2015 | $1,245 | $60,985 | $8,750 | $52,235 |
| 2014 | $1,208 | $42,293 | $8,750 | $33,543 |
Source: Public Records
Map
Nearby Homes
- 375 Habib Way
- 364 Sam Way
- 294 Sam Way
- 463 Hagens Aly
- 287 Sam Way
- Beckett Plan at The Fields
- Weston Plan at The Fields
- Graham Plan at The Fields
- 254 Reber Dr
- 271 Concord Dr
- 777 2nd St S
- 228 Hiawatha Way
- 162 Hermosa Way
- 871 Falcon Glenn Dr
- 262 Thistle St
- 844 Sagedell Rd
- 844 Glendale Rd
- 517 W Mesquite Blvd
- 468 Apogee Crest St
- 479 Apogee Crest St
- 371 Verllonia St
- 888 Amina Cir
- 361 Verllonia St
- 879 Amina Cir
- 382 Verllonia St
- 372 Verllonia St
- 351 Verllonia St
- 362 Verllonia St
- 889 Amina Cir
- 896 Amina Cir
- 352 Verllonia St
- 341 Verllonia St
- 381 Kelkim St
- 371 Kelkim St
- 361 Kelkim St
- 342 Verllonia St
- 899 Amina Cir
- 331 Verllonia St
- 351 Kelkim St
- 890 Wasi Ln