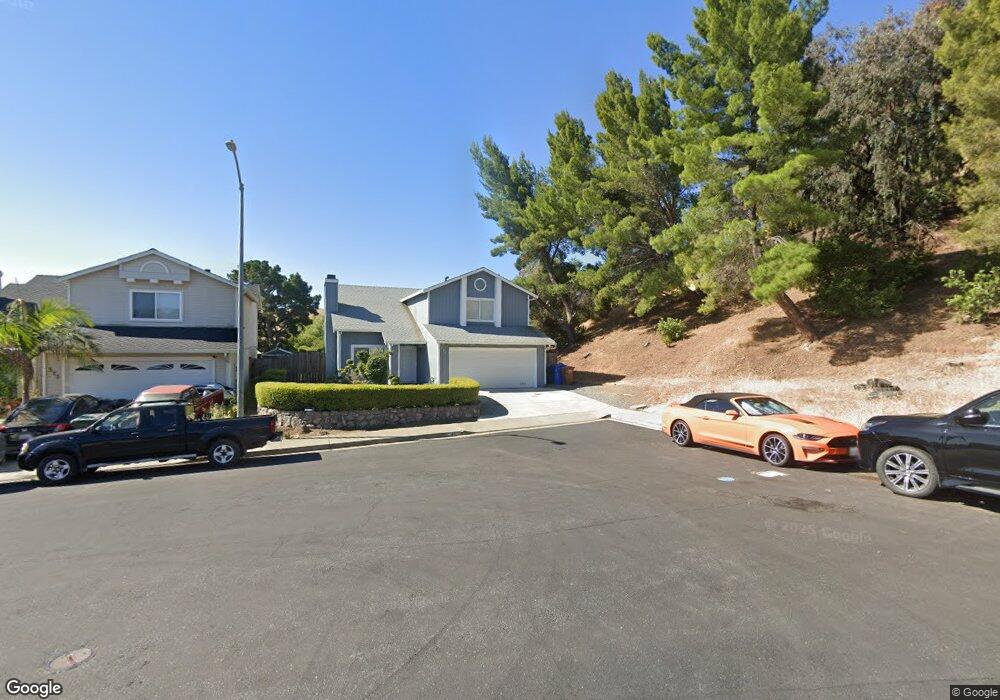
381 Waterview Place Bay Point, CA 94565
Estimated Value: $614,000 - $693,000
4
Beds
3
Baths
1,579
Sq Ft
$415/Sq Ft
Est. Value
About This Home
This home is located at 381 Waterview Place, Bay Point, CA 94565 and is currently estimated at $655,927, approximately $415 per square foot. 381 Waterview Place is a home located in Contra Costa County with nearby schools including Rio Vista Elementary School, Riverview Middle School, and Mt. Diablo High School.
Ownership History
Date
Name
Owned For
Owner Type
Purchase Details
Closed on
Aug 9, 2019
Sold by
Tran Lisa Thi and Tran Thanh Ngoc
Bought by
Tran Lisa Thi and Tran Thanh Ngoc
Current Estimated Value
Home Financials for this Owner
Home Financials are based on the most recent Mortgage that was taken out on this home.
Original Mortgage
$466,871
Outstanding Balance
$408,893
Interest Rate
3.7%
Mortgage Type
New Conventional
Estimated Equity
$247,034
Purchase Details
Closed on
Nov 16, 2018
Sold by
Open Paths Investments Ii Llc
Bought by
Phan Lisa Thi and Tran Thanh Ngoc
Home Financials for this Owner
Home Financials are based on the most recent Mortgage that was taken out on this home.
Original Mortgage
$453,382
Interest Rate
4.9%
Mortgage Type
New Conventional
Purchase Details
Closed on
Aug 30, 2018
Sold by
Robbins Lisa D
Bought by
Open Paths Investments Ii Llc
Create a Home Valuation Report for This Property
The Home Valuation Report is an in-depth analysis detailing your home's value as well as a comparison with similar homes in the area
Home Values in the Area
Average Home Value in this Area
Purchase History
| Date | Buyer | Sale Price | Title Company |
|---|---|---|---|
| Tran Lisa Thi | -- | Fidelity National Title Co | |
| Phan Lisa Thi | $492,000 | Old Republic Title Company | |
| Open Paths Investments Ii Llc | $336,000 | First American Title Company |
Source: Public Records
Mortgage History
| Date | Status | Borrower | Loan Amount |
|---|---|---|---|
| Open | Tran Lisa Thi | $466,871 | |
| Closed | Phan Lisa Thi | $453,382 |
Source: Public Records
Tax History
| Year | Tax Paid | Tax Assessment Tax Assessment Total Assessment is a certain percentage of the fair market value that is determined by local assessors to be the total taxable value of land and additions on the property. | Land | Improvement |
|---|---|---|---|---|
| 2025 | $7,074 | $548,831 | $200,792 | $348,039 |
| 2024 | $6,761 | $538,070 | $196,855 | $341,215 |
| 2023 | $6,761 | $527,521 | $192,996 | $334,525 |
| 2022 | $6,711 | $517,178 | $189,212 | $327,966 |
| 2021 | $6,563 | $507,038 | $185,502 | $321,536 |
| 2019 | $6,423 | $492,000 | $180,000 | $312,000 |
| 2018 | $3,182 | $217,729 | $53,814 | $163,915 |
| 2017 | $3,086 | $213,460 | $52,759 | $160,701 |
| 2016 | $2,996 | $209,275 | $51,725 | $157,550 |
| 2015 | $2,963 | $206,133 | $50,949 | $155,184 |
| 2014 | $2,913 | $202,096 | $49,951 | $152,145 |
Source: Public Records
Map
Nearby Homes
- 744 Treasure Dr
- 215 San Bernardino Ct
- 621 Bounty Dr
- 3777 Willow Pass Rd Unit 85
- 3777 Willow Pass Rd Unit 20
- 323 Rosemarie Place
- 97 Harbor Dr
- 55 Pacifica Ave Unit 49
- 55 Pacifica Ave Unit 77
- 55 Pacifica Ave Unit 90
- 55 Pacifica Ave Unit 146
- 469 Powell Dr
- 93 Beach Dr
- 92 Beach Dr
- 87 Bay Dr
- 94 Anchor Dr
- 417 Mystic Ln
- 39 Harbor Dr
- 558 Fletcher St
- 39 Canal Dr
- 373 Waterview Place
- 365 Waterview Place
- 357 Waterview Place
- 264 Sandy Cove Ln
- 256 Sandy Cove Ln
- 372 Waterview Place
- 380 Waterview Place
- 364 Waterview Place
- 388 Waterview Place
- 356 Waterview Place
- 248 Sandy Cove Ln
- 341 Waterview Place
- 51 Beaulieu Place
- 348 Waterview Place
- 240 Sandy Cove Ln
- 333 Waterview Place
- 340 Waterview Place
- 259 Sandy Cove Ln
- 55 Beaulieu Place
- 251 Sandy Cove Ln
Your Personal Tour Guide
Ask me questions while you tour the home.