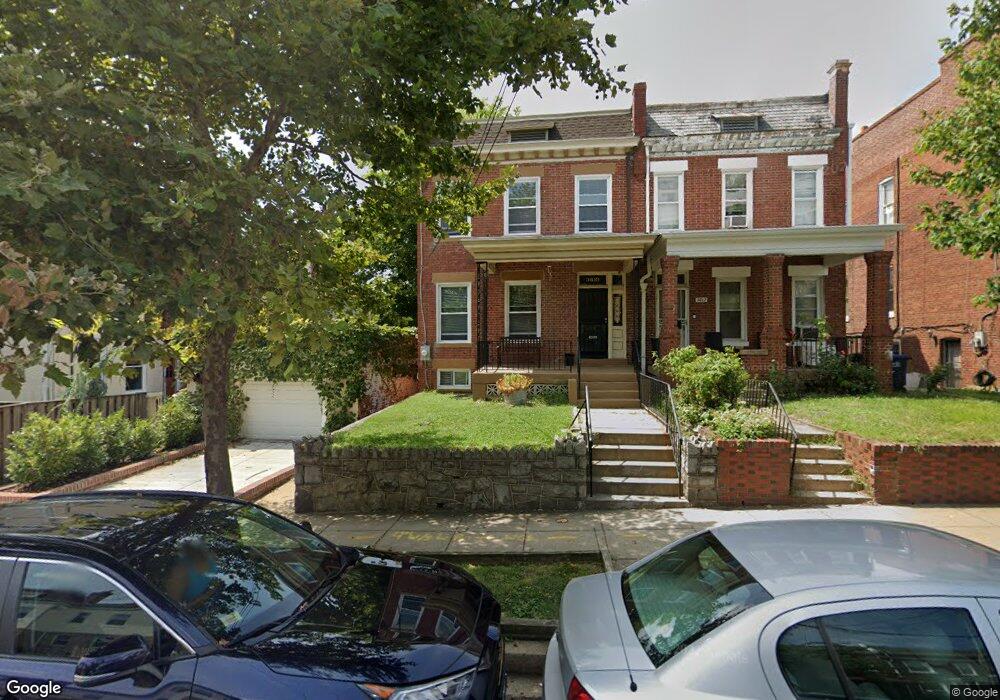
3810 7th St NW Washington, DC 20011
Petworth NeighborhoodEstimated Value: $703,000 - $838,000
3
Beds
2
Baths
1,378
Sq Ft
$551/Sq Ft
Est. Value
About This Home
This home is located at 3810 7th St NW, Washington, DC 20011 and is currently estimated at $758,785, approximately $550 per square foot. 3810 7th St NW is a home located in District of Columbia with nearby schools including Bruce-Monroe Elementary School @ Park View, MacFarland Middle School, and Roosevelt High School @ MacFarland.
Ownership History
Date
Name
Owned For
Owner Type
Purchase Details
Closed on
Feb 24, 2016
Sold by
Magruder-Johnson Doris P
Bought by
Magruder-Johnson Doris P
Current Estimated Value
Home Financials for this Owner
Home Financials are based on the most recent Mortgage that was taken out on this home.
Original Mortgage
$922,500
Outstanding Balance
$905,199
Interest Rate
3.89%
Mortgage Type
Reverse Mortgage Home Equity Conversion Mortgage
Estimated Equity
-$146,414
Purchase Details
Closed on
Feb 15, 1996
Sold by
Christopher William E
Bought by
Milanez Doris P
Home Financials for this Owner
Home Financials are based on the most recent Mortgage that was taken out on this home.
Original Mortgage
$115,849
Interest Rate
6.99%
Purchase Details
Closed on
Dec 16, 1994
Sold by
Hall Gladys R
Bought by
Christopher William E
Home Financials for this Owner
Home Financials are based on the most recent Mortgage that was taken out on this home.
Original Mortgage
$75,000
Interest Rate
9.03%
Create a Home Valuation Report for This Property
The Home Valuation Report is an in-depth analysis detailing your home's value as well as a comparison with similar homes in the area
Home Values in the Area
Average Home Value in this Area
Purchase History
| Date | Buyer | Sale Price | Title Company |
|---|---|---|---|
| Magruder-Johnson Doris P | -- | None Available | |
| Milanez Doris P | -- | -- | |
| Christopher William E | $61,500 | -- |
Source: Public Records
Mortgage History
| Date | Status | Borrower | Loan Amount |
|---|---|---|---|
| Open | Magruder-Johnson Doris P | $922,500 | |
| Previous Owner | Milanez Doris P | $115,849 | |
| Previous Owner | Christopher William E | $75,000 |
Source: Public Records
Tax History Compared to Growth
Tax History
| Year | Tax Paid | Tax Assessment Tax Assessment Total Assessment is a certain percentage of the fair market value that is determined by local assessors to be the total taxable value of land and additions on the property. | Land | Improvement |
|---|---|---|---|---|
| 2024 | $6,524 | $767,530 | $486,440 | $281,090 |
| 2023 | $6,348 | $746,780 | $474,630 | $272,150 |
| 2022 | $5,885 | $692,370 | $448,250 | $244,120 |
| 2021 | $5,676 | $667,810 | $432,560 | $235,250 |
| 2020 | $5,143 | $605,090 | $418,400 | $186,690 |
| 2019 | $4,887 | $574,980 | $392,520 | $182,460 |
| 2018 | $4,707 | $553,760 | $0 | $0 |
| 2017 | $4,074 | $479,350 | $0 | $0 |
| 2016 | $3,706 | $435,960 | $0 | $0 |
| 2015 | $3,365 | $395,880 | $0 | $0 |
| 2014 | $2,884 | $339,320 | $0 | $0 |
Source: Public Records
Map
Nearby Homes
- 3901 New Hampshire Ave NW
- 618 Randolph St NW Unit 1
- 735 Rock Creek Church Rd NW Unit A
- 722 Shepherd St NW
- 641 Quebec Place NW Unit 2
- 641 Quebec Place NW Unit 1
- 719 Quebec Place NW
- 721 Quebec Place NW
- 3916 8th St NW Unit A
- 3916 8th St NW Unit B
- 610 Rock Creek Church Rd NW
- 509 Randolph St NW Unit 2
- 509 Randolph St NW Unit 1
- 3916 5th St NW
- 622 Quebec Place NW
- 3811 5th St NW
- 755 Quebec Place NW
- 709 Princeton Place NW
- 710 Taylor St NW
- 726 Taylor St NW
- 3812 7th St NW
- 705 Quincy St NW
- 3816 7th St NW
- 707 Quincy St NW
- 703 Quincy St NW
- 709 Quincy St NW
- 701 Quincy St NW
- 711 Quincy St NW
- 3818 7th St NW
- 713 Quincy St NW
- 3820 7th St NW
- 715 Quincy St NW
- 715 Quincy St NW Unit BASEMENT
- 717 Quincy St NW
- 719 Quincy St NW
- 721 Quincy St NW
- 3801 7th St NW
- 3811 7th St NW
- 723 Quincy St NW
- 706 Randolph St NW