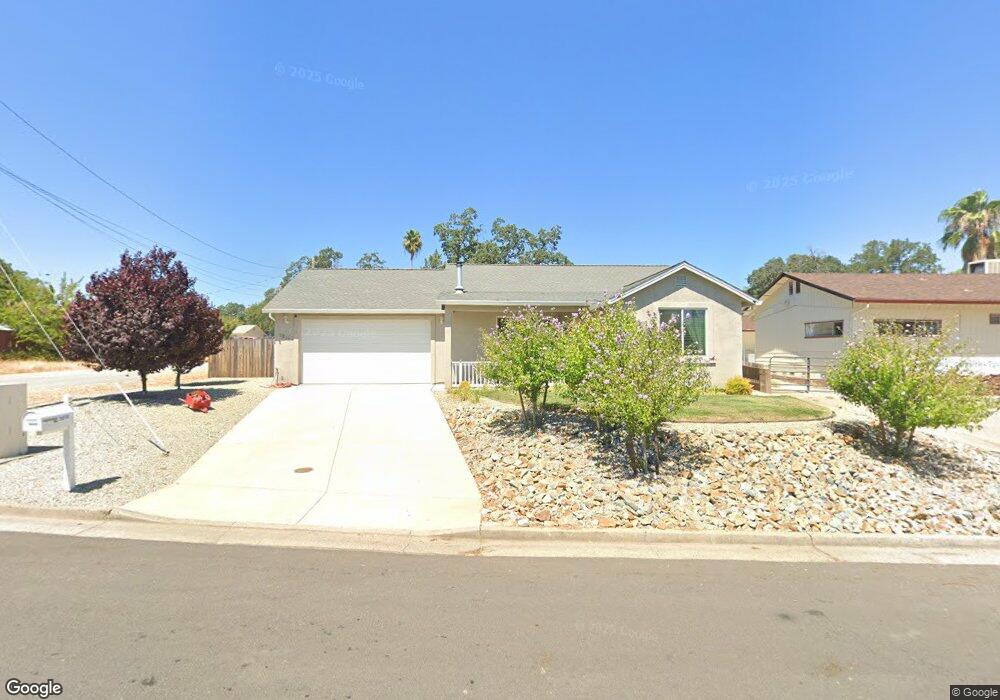
3810 Saint Nicholas Ave Redding, CA 96003
Buckeye NeighborhoodEstimated Value: $218,000 - $297,695
2
Beds
2
Baths
1,029
Sq Ft
$263/Sq Ft
Est. Value
About This Home
This home is located at 3810 Saint Nicholas Ave, Redding, CA 96003 and is currently estimated at $270,924, approximately $263 per square foot. 3810 Saint Nicholas Ave is a home with nearby schools including Rocky Point Charter School.
Ownership History
Date
Name
Owned For
Owner Type
Purchase Details
Closed on
Jun 18, 2021
Sold by
Gunlogson Mark Aime and Gunlogson Janice Kay
Bought by
Muncy Kyle B and Muncy Tracy L
Current Estimated Value
Home Financials for this Owner
Home Financials are based on the most recent Mortgage that was taken out on this home.
Original Mortgage
$121,500
Outstanding Balance
$110,055
Interest Rate
2.93%
Mortgage Type
New Conventional
Estimated Equity
$160,869
Purchase Details
Closed on
Apr 14, 2020
Sold by
Gunner Inc
Bought by
Guntogson Mark Aime and Guntogson Janice Kay
Purchase Details
Closed on
Dec 19, 2019
Sold by
Todd Clifford E and Todd Shirley A
Bought by
Gunner Inc
Purchase Details
Closed on
Dec 8, 2009
Sold by
Todd Clifford E
Bought by
Todd Clifford E and Todd Shirley A
Purchase Details
Closed on
Sep 17, 1998
Sold by
Hemsted Muriel T
Bought by
Hemsted Muriel N
Create a Home Valuation Report for This Property
The Home Valuation Report is an in-depth analysis detailing your home's value as well as a comparison with similar homes in the area
Home Values in the Area
Average Home Value in this Area
Purchase History
| Date | Buyer | Sale Price | Title Company |
|---|---|---|---|
| Muncy Kyle B | $175,000 | Placer Title Company | |
| Guntogson Mark Aime | -- | None Available | |
| Gunner Inc | $28,000 | Placer Title Company | |
| Todd Clifford E | -- | None Available | |
| Hemsted Muriel N | -- | -- |
Source: Public Records
Mortgage History
| Date | Status | Borrower | Loan Amount |
|---|---|---|---|
| Open | Muncy Kyle B | $121,500 |
Source: Public Records
Tax History
| Year | Tax Paid | Tax Assessment Tax Assessment Total Assessment is a certain percentage of the fair market value that is determined by local assessors to be the total taxable value of land and additions on the property. | Land | Improvement |
|---|---|---|---|---|
| 2025 | $3,031 | $281,219 | $47,754 | $233,465 |
| 2024 | $2,974 | $275,706 | $46,818 | $228,888 |
| 2023 | $2,974 | $270,300 | $45,900 | $224,400 |
| 2022 | $2,895 | $265,000 | $45,000 | $220,000 |
| 2021 | $2,122 | $193,290 | $25,259 | $168,031 |
| 2020 | $373 | $31,967 | $28,909 | $3,058 |
| 2019 | $362 | $31,342 | $28,343 | $2,999 |
| 2018 | $362 | $30,729 | $27,788 | $2,941 |
| 2017 | $356 | $30,128 | $27,244 | $2,884 |
| 2016 | $341 | $29,538 | $26,710 | $2,828 |
| 2015 | $336 | $29,095 | $26,309 | $2,786 |
| 2014 | $338 | $28,526 | $25,794 | $2,732 |
Source: Public Records
Map
Nearby Homes
- 852 Lake Blvd
- 836 August Way
- 830 Middle St
- 3605 Tamarack Dr
- 3345 Golden Heights Dr
- 750 Oleta Dr
- 3588 Magnums Way
- 0 Lake Blvd
- 4098 Saint Patricks Ave
- 3586 E Keswick Dam Rd
- 4160 Easter Ave
- 1220 Pershing St
- 1046 Shawnee Trail Unit 109
- 3041 Panorama Dr
- 1439 Calexico Dr
- 1025 Mountain Shadows Blvd
- 4288 Bradley Dr
- 1450 Calexico Dr
- 3105 Jordan Ln
- 1059 Eagle Nest Rd
- 3820 Saint Nicholas Ave Unit 1
- 3820 Saint Nicholas Ave
- 928 July Way
- 3746 Saint Nicholas Ave
- 3839 St Nicholas Ave
- 942 July Way
- 895 July Way
- 3880 Saint Nicholas Ave
- 3880 St Nicholas Ave
- 3726 Saint Nicholas Ave
- 933 July Way
- 978 July Way
- 0 July Way
- 3745 Saint Nicholas Ave
- 4005 St Nicholas
- 945 July Way
- 3745 St Nicholas
- 4060 St Nicholas
- 959 August Way
- 889 July Way
Your Personal Tour Guide
Ask me questions while you tour the home.