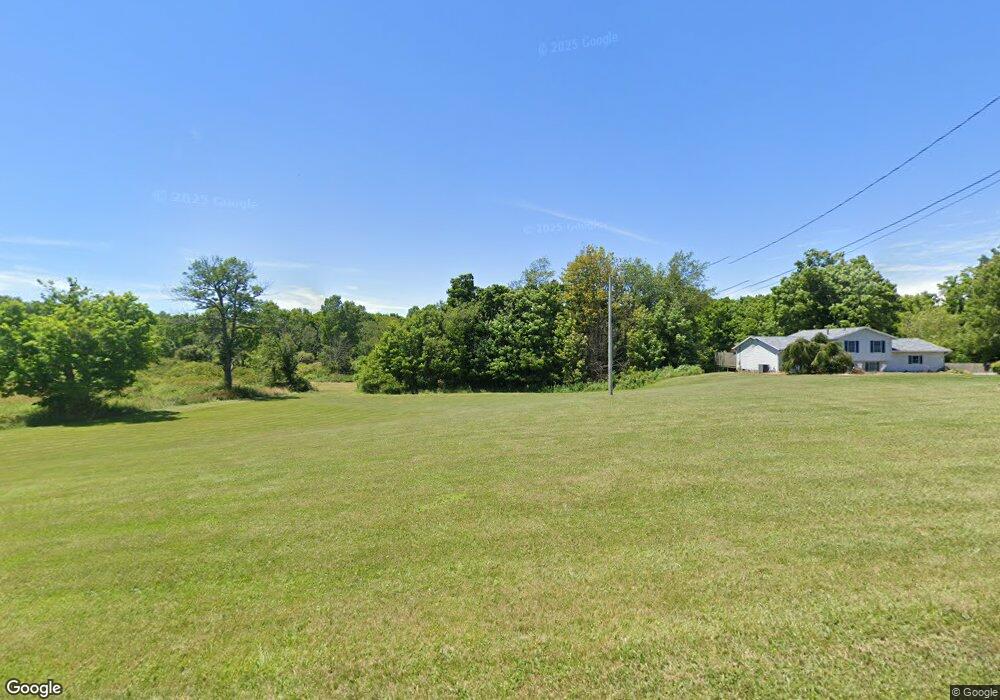
3811 Alliance Rd Rootstown, OH 44272
Estimated Value: $386,000 - $419,000
3
Beds
2
Baths
1,778
Sq Ft
$229/Sq Ft
Est. Value
About This Home
This home is located at 3811 Alliance Rd, Rootstown, OH 44272 and is currently estimated at $406,736, approximately $228 per square foot. 3811 Alliance Rd is a home located in Portage County with nearby schools including Southeast High School.
Ownership History
Date
Name
Owned For
Owner Type
Purchase Details
Closed on
Jul 28, 2011
Sold by
Secretary Of Housing & Urban Development
Bought by
Rouse Eric
Current Estimated Value
Purchase Details
Closed on
Mar 17, 2011
Sold by
Phh Mortgage Corporation
Bought by
Secretary Of Housing & Urban Development
Purchase Details
Closed on
Mar 4, 2011
Sold by
Wilson Kasey L
Bought by
Phh Mortgage Corporation
Purchase Details
Closed on
Sep 12, 2006
Sold by
Paolucci Brian V and Paolucci Linda L
Bought by
Wilson Chad M and Wilson Kasey L
Home Financials for this Owner
Home Financials are based on the most recent Mortgage that was taken out on this home.
Original Mortgage
$243,397
Interest Rate
6.49%
Mortgage Type
FHA
Create a Home Valuation Report for This Property
The Home Valuation Report is an in-depth analysis detailing your home's value as well as a comparison with similar homes in the area
Purchase History
| Date | Buyer | Sale Price | Title Company |
|---|---|---|---|
| Rouse Eric | $170,000 | Attorney | |
| Secretary Of Housing & Urban Development | -- | Attorney | |
| Phh Mortgage Corporation | $165,000 | None Available | |
| Wilson Chad M | $247,300 | Approved Statewide Title Age |
Source: Public Records
Mortgage History
| Date | Status | Borrower | Loan Amount |
|---|---|---|---|
| Previous Owner | Wilson Chad M | $243,397 |
Source: Public Records
Tax History
| Year | Tax Paid | Tax Assessment Tax Assessment Total Assessment is a certain percentage of the fair market value that is determined by local assessors to be the total taxable value of land and additions on the property. | Land | Improvement |
|---|---|---|---|---|
| 2025 | $4,834 | $127,930 | $26,460 | $101,470 |
| 2024 | $4,724 | $127,930 | $26,460 | $101,470 |
| 2023 | $3,911 | $94,890 | $22,860 | $72,030 |
| 2022 | $4,058 | $94,890 | $22,860 | $72,030 |
| 2021 | $4,092 | $94,890 | $22,860 | $72,030 |
| 2020 | $3,696 | $82,360 | $20,790 | $61,570 |
| 2019 | $3,706 | $82,360 | $20,790 | $61,570 |
| 2018 | $3,727 | $78,120 | $21,770 | $56,350 |
| 2017 | $3,727 | $78,120 | $21,770 | $56,350 |
| 2016 | $3,714 | $78,120 | $21,770 | $56,350 |
| 2015 | $3,558 | $78,120 | $21,770 | $56,350 |
| 2014 | $3,495 | $74,940 | $21,770 | $53,170 |
| 2013 | $3,409 | $74,940 | $21,770 | $53,170 |
Source: Public Records
Map
Nearby Homes
- 8464 & 8446 Tallmadge Rd
- 8492 & 8476 Tallmadge Rd
- 3545 Porter Rd
- 0 Wayland Rd Unit 5191883
- 3798 State Route 183
- 3609 State Route 225
- 4133 State Route 225
- 0 Ohio 225 Unit 5174573
- 3207 Prairie Cir
- 6747 Giddings Rd
- 0 Yale Rd Unit 5190725
- 0 John Thomas
- 2434 Taft Ave
- 9672 Whippoorwill Rd
- 2639 Ohio 183
- 9865 Tallmadge Rd
- 4087 Industry
- 941 Porter Rd
- 00 Ohio 14
- 1731 Ohio 225
- 3833 Alliance Rd
- 3845 Alliance Rd
- V/L3 Alliance Rd
- 3717 Alliance Rd
- 3802 Alliance Rd
- 3900 Alliance Rd
- 3936 Alliance Rd
- 3634 Alliance Rd
- 3950 Alliance Rd
- 0 Alliance Rd
- 3966 Alliance Rd
- 3968 Alliance Rd
- 8006 Tallmadge Rd
- 4000 Alliance Rd
- 8298 Henderson Rd
- 9999 Tallmadge Rd
- 8079 Tallmadge Rd
- 8160 Tallmadge Rd
- 0 Alliance Rd Unit 1029937
- 0 Alliance Rd Unit 4506376
Your Personal Tour Guide
Ask me questions while you tour the home.