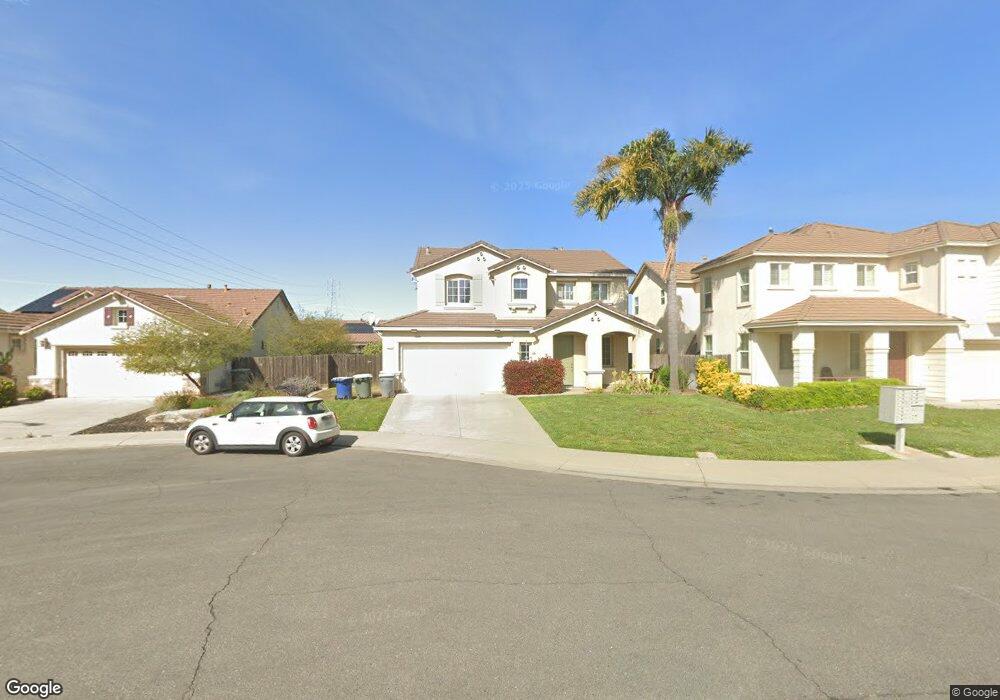
3811 Colma Ct Merced, CA 95348
Estimated Value: $439,000 - $491,000
4
Beds
3
Baths
2,372
Sq Ft
$198/Sq Ft
Est. Value
About This Home
This home is located at 3811 Colma Ct, Merced, CA 95348 and is currently estimated at $468,870, approximately $197 per square foot. 3811 Colma Ct is a home located in Merced County with nearby schools including Franklin Elementary School, Rudolph Rivera Middle School, and El Capitan High School.
Ownership History
Date
Name
Owned For
Owner Type
Purchase Details
Closed on
Oct 6, 2017
Sold by
Li Yu
Bought by
Yu Yang and Zhou Jie
Current Estimated Value
Purchase Details
Closed on
Dec 3, 2014
Sold by
Shin Jeong Yeon
Bought by
Li Yu
Purchase Details
Closed on
Jun 8, 2010
Sold by
Jew Kenneth and Jew Rochelle
Bought by
Shin Jeong Yeon
Home Financials for this Owner
Home Financials are based on the most recent Mortgage that was taken out on this home.
Original Mortgage
$172,674
Interest Rate
4.79%
Mortgage Type
FHA
Purchase Details
Closed on
Nov 4, 2005
Sold by
Merced Shadow Creek Lp
Bought by
Jew Kenneth and Jew Rochelle
Home Financials for this Owner
Home Financials are based on the most recent Mortgage that was taken out on this home.
Original Mortgage
$258,500
Interest Rate
5.9%
Mortgage Type
Fannie Mae Freddie Mac
Create a Home Valuation Report for This Property
The Home Valuation Report is an in-depth analysis detailing your home's value as well as a comparison with similar homes in the area
Purchase History
| Date | Buyer | Sale Price | Title Company |
|---|---|---|---|
| Yu Yang | $230,000 | Transcounty Title Company | |
| Li Yu | -- | Transcounty Title Company | |
| Li Yu | $230,000 | Fidelity National Title Co | |
| Shin Jeong Yeon | $175,000 | Transcounty Title Company | |
| Jew Kenneth | $447,000 | Old Republic Title Company |
Source: Public Records
Mortgage History
| Date | Status | Borrower | Loan Amount |
|---|---|---|---|
| Previous Owner | Shin Jeong Yeon | $172,674 | |
| Previous Owner | Jew Kenneth | $258,500 |
Source: Public Records
Tax History
| Year | Tax Paid | Tax Assessment Tax Assessment Total Assessment is a certain percentage of the fair market value that is determined by local assessors to be the total taxable value of land and additions on the property. | Land | Improvement |
|---|---|---|---|---|
| 2025 | $4,767 | $347,033 | $51,200 | $295,833 |
| 2024 | $4,767 | $340,230 | $50,197 | $290,033 |
| 2023 | $4,684 | $333,560 | $49,213 | $284,347 |
| 2022 | $4,581 | $327,021 | $48,249 | $278,772 |
| 2021 | $4,501 | $320,609 | $47,303 | $273,306 |
| 2020 | $4,511 | $317,322 | $46,818 | $270,504 |
| 2019 | $4,438 | $311,100 | $45,900 | $265,200 |
| 2018 | $4,108 | $305,000 | $45,000 | $260,000 |
| 2017 | $3,527 | $238,175 | $36,243 | $201,932 |
| 2016 | $3,460 | $233,506 | $35,533 | $197,973 |
| 2015 | $3,403 | $230,000 | $35,000 | $195,000 |
| 2014 | $2,788 | $182,894 | $11,495 | $171,399 |
Source: Public Records
Map
Nearby Homes
- 1277 Baxter Dr
- 3749 Morningside Ave
- 3742 Morningside Ave
- 3759 Larkspur Ave
- 1281 Sunup Dr
- 1255 Day Light Dr
- 3880 Early Light Ave
- 1378 Cassis Dr
- 3622 N State Highway 59
- 3910 Twilight Ave
- 1525 La Sierra St
- 1227 Cavalaire Ct
- 1151 Mazatlan Place
- 1201 W Donna Dr
- 3406 San Martin Ct
- 954 Wake Forest Ct
- 4163 Scarlet Ct
- 4170 Clary Ct
- 4152 Scarlet Ct
- 4187 Scarlet Ct
Your Personal Tour Guide
Ask me questions while you tour the home.