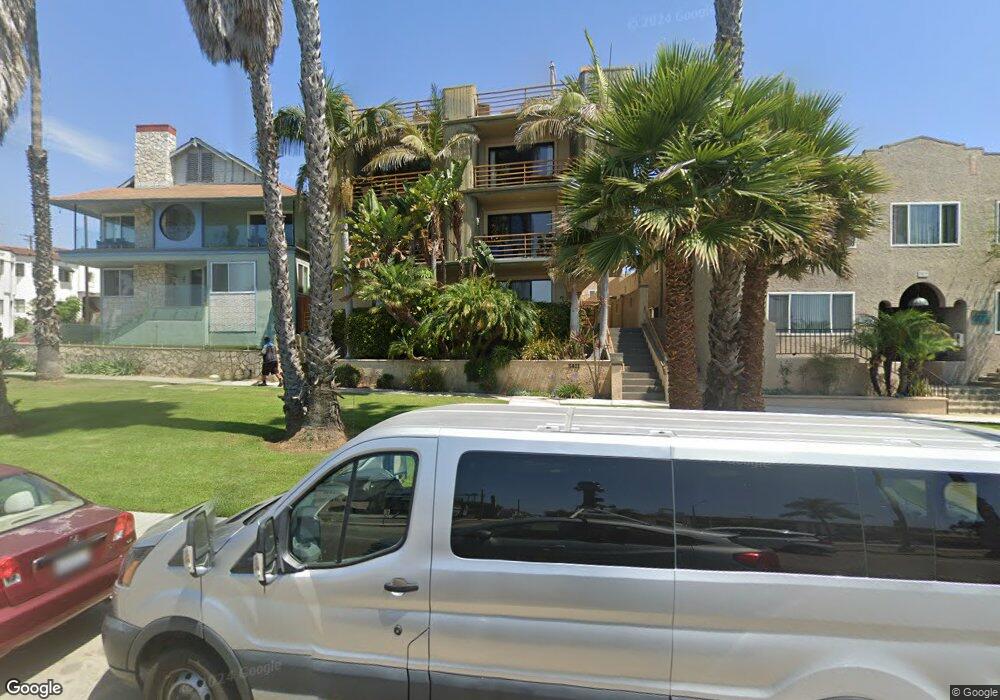
3811 E Livingston Dr Unit 4 Long Beach, CA 90803
Belmont Heights NeighborhoodEstimated Value: $963,000 - $1,052,976
3
Beds
2
Baths
2,129
Sq Ft
$472/Sq Ft
Est. Value
About This Home
This home is located at 3811 E Livingston Dr Unit 4, Long Beach, CA 90803 and is currently estimated at $1,004,744, approximately $471 per square foot. 3811 E Livingston Dr Unit 4 is a home located in Los Angeles County with nearby schools including Mann Elementary School, Woodrow Wilson High School, and Maple Village Waldorf School.
Ownership History
Date
Name
Owned For
Owner Type
Purchase Details
Closed on
Sep 21, 2016
Sold by
Cline Zulmara and Cline Paul E
Bought by
Cline Paul Edward and Cline Zulmara
Current Estimated Value
Purchase Details
Closed on
Jul 2, 2012
Sold by
Overhiser Charles E and Overhiser Dorothy A
Bought by
Cline Zulmara and Cline Paul E
Home Financials for this Owner
Home Financials are based on the most recent Mortgage that was taken out on this home.
Original Mortgage
$356,000
Outstanding Balance
$244,627
Interest Rate
3.65%
Mortgage Type
New Conventional
Estimated Equity
$760,117
Purchase Details
Closed on
Jan 27, 2006
Sold by
Overhiser Charles E and Overhiser Dorothy A
Bought by
Overhiser Charles E and Overhiser Dorothy A
Home Financials for this Owner
Home Financials are based on the most recent Mortgage that was taken out on this home.
Original Mortgage
$560,000
Interest Rate
6.15%
Mortgage Type
New Conventional
Create a Home Valuation Report for This Property
The Home Valuation Report is an in-depth analysis detailing your home's value as well as a comparison with similar homes in the area
Home Values in the Area
Average Home Value in this Area
Purchase History
| Date | Buyer | Sale Price | Title Company |
|---|---|---|---|
| Cline Paul Edward | -- | None Available | |
| Cline Zulmara | $445,000 | North American Title Company | |
| Overhiser Charles E | -- | Progressive Title Co Inc |
Source: Public Records
Mortgage History
| Date | Status | Borrower | Loan Amount |
|---|---|---|---|
| Open | Cline Zulmara | $356,000 | |
| Previous Owner | Overhiser Charles E | $560,000 |
Source: Public Records
Tax History Compared to Growth
Tax History
| Year | Tax Paid | Tax Assessment Tax Assessment Total Assessment is a certain percentage of the fair market value that is determined by local assessors to be the total taxable value of land and additions on the property. | Land | Improvement |
|---|---|---|---|---|
| 2025 | $7,237 | $547,973 | $307,852 | $240,121 |
| 2024 | $6,911 | $537,229 | $301,816 | $235,413 |
| 2023 | $6,795 | $526,697 | $295,899 | $230,798 |
| 2022 | $6,377 | $516,371 | $290,098 | $226,273 |
| 2021 | $6,243 | $506,247 | $284,410 | $221,837 |
| 2020 | $6,225 | $501,057 | $281,494 | $219,563 |
| 2019 | $6,151 | $491,233 | $275,975 | $215,258 |
| 2018 | $6,003 | $481,602 | $270,564 | $211,038 |
| 2016 | $5,508 | $462,902 | $260,058 | $202,844 |
| 2015 | $5,285 | $455,950 | $256,152 | $199,798 |
| 2014 | $5,246 | $447,020 | $251,135 | $195,885 |
Source: Public Records
Map
Nearby Homes
- 3811 E Livingston Dr Unit 1
- 3707 E Livingston Dr Unit 403
- 3901 E Livingston Dr Unit 402
- 3939 E Allin St Unit 109
- 3641 E 1st St
- 116 Termino Ave
- 7 37th Place
- 202 Mira Mar Ave
- 207 Mira Mar Ave
- 3737 E 2nd St Unit 301
- 3601 E Ocean Blvd Unit 2C
- 210 Grand Ave Unit 201
- 16 36th Place Unit F
- 215 Mira Mar Ave
- 206 Euclid Ave
- 4257 E Ocean Blvd
- 60 Bennett Ave
- 111 Ximeno Ave
- 242 Euclid Ave
- 249 Loma Ave
- 3811 E Livingston Dr Unit 102
- 3811 E Livingston Dr Unit 204
- 3811 E Livingston Dr Unit 103
- 3811 E Livingston Dr Unit 203
- 3811 E Livingston Dr Unit 104
- 3811 E Livingston Dr Unit 201
- 3811 E Livingston Dr Unit 8
- 3811 E Livingston Dr Unit 7
- 3811 E Livingston Dr Unit 6
- 3811 E Livingston Dr Unit 5
- 3811 E Livingston Dr Unit 3
- 3811 E Livingston Dr Unit 2
- 20 Grand Ave
- 3817 E Livingston Dr
- 3822 E 1st St Unit 3
- 3822 E 1st St Unit 2
- 3822 E 1st St Unit 1
- 3822 E 1st St Unit 8
- 3822 E 1st St Unit 7
- 3822 E 1st St Unit 6