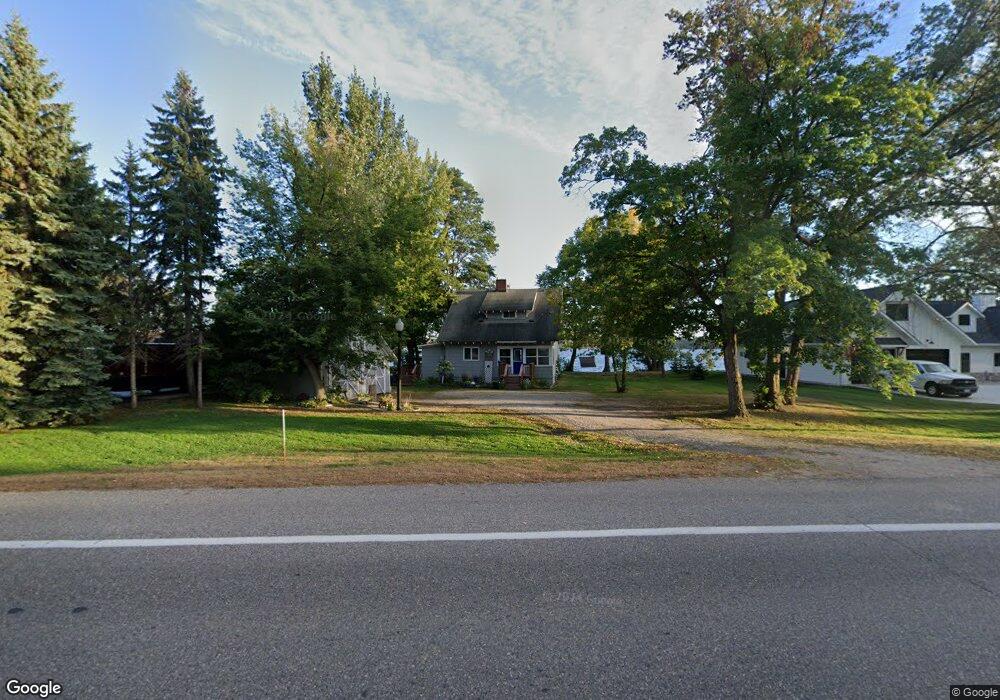
3811 N Nokomis NE Alexandria, MN 56308
Estimated Value: $591,162 - $624,000
--
Bed
--
Bath
934
Sq Ft
$651/Sq Ft
Est. Value
About This Home
This home is located at 3811 N Nokomis NE, Alexandria, MN 56308 and is currently estimated at $608,387, approximately $651 per square foot. 3811 N Nokomis NE is a home located in Douglas County with nearby schools including Voyager Elementary School, Discovery Middle School, and Alexandria Area High School.
Ownership History
Date
Name
Owned For
Owner Type
Purchase Details
Closed on
May 28, 2020
Sold by
Alton Charles N
Bought by
Rambow Julie L
Current Estimated Value
Home Financials for this Owner
Home Financials are based on the most recent Mortgage that was taken out on this home.
Original Mortgage
$360,000
Interest Rate
3.3%
Mortgage Type
Commercial
Purchase Details
Closed on
Dec 13, 2019
Sold by
Alton Charles N
Bought by
Rambow Julle L
Home Financials for this Owner
Home Financials are based on the most recent Mortgage that was taken out on this home.
Original Mortgage
$360,990
Interest Rate
5%
Mortgage Type
Land Contract Argmt. Of Sale
Purchase Details
Closed on
Sep 14, 2018
Sold by
Elliott Patrick H
Bought by
Alton Charles N
Purchase Details
Closed on
Jan 20, 2012
Sold by
Obert Thomas John
Bought by
Anderson Thomas J
Create a Home Valuation Report for This Property
The Home Valuation Report is an in-depth analysis detailing your home's value as well as a comparison with similar homes in the area
Home Values in the Area
Average Home Value in this Area
Purchase History
| Date | Buyer | Sale Price | Title Company |
|---|---|---|---|
| Rambow Julie L | $382,000 | None Available | |
| Rambow Julle L | $382,000 | None Available | |
| Alton Charles N | -- | None Available | |
| Anderson Thomas J | $229,500 | None Available |
Source: Public Records
Mortgage History
| Date | Status | Borrower | Loan Amount |
|---|---|---|---|
| Closed | Rambow Julie L | $360,000 | |
| Previous Owner | Rambow Julle L | $360,990 |
Source: Public Records
Tax History Compared to Growth
Tax History
| Year | Tax Paid | Tax Assessment Tax Assessment Total Assessment is a certain percentage of the fair market value that is determined by local assessors to be the total taxable value of land and additions on the property. | Land | Improvement |
|---|---|---|---|---|
| 2025 | $7,758 | $633,400 | $516,600 | $116,800 |
| 2024 | $7,758 | $629,400 | $516,600 | $112,800 |
| 2023 | $7,356 | $564,400 | $463,100 | $101,300 |
| 2022 | $6,000 | $463,900 | $338,400 | $125,500 |
| 2021 | $4,744 | $402,100 | $293,900 | $108,200 |
| 2020 | $5,518 | $382,600 | $285,000 | $97,600 |
| 2019 | $5,658 | $379,100 | $271,200 | $107,900 |
| 2018 | $5,472 | $377,100 | $258,300 | $118,800 |
| 2017 | $5,150 | $359,900 | $258,300 | $101,600 |
| 2016 | $5,404 | $331,934 | $250,551 | $81,383 |
| 2015 | $5,292 | $0 | $0 | $0 |
| 2014 | -- | $320,500 | $240,500 | $80,000 |
Source: Public Records
Map
Nearby Homes
- 3610 N Nokomis NE Unit 401
- 3877 Tolena Rd NE
- 3608 Tolena Rd NE
- 3307 N Nokomis NE
- 3208 N Nokomis NE
- 105 Ross Garden NW
- 2904 Le Homme Dieu View NE
- 3110 Van Ave NE Unit 1
- 4864 County Road 42 NE Unit 11
- 2703 Le Homme Dieu View NE
- 4974 Interlachen Dr NE
- 2807 Government Point Rd NE
- 2600 Le Homme Dieu View NE
- 2578 Cherry Lane Ct NE
- 1744 Old County Road 120 NE Unit 3
- 2606 Sessions St NW
- 2501 Le Homme Dieu View NE
- 7826 unit 9 County Road 42 NE
- 7826 unit 8 County Road 42 NE
- 7826 unit 7 County Road 42 NE
- 802 Bay Ln NE
- 3807 N Nokomis NE
- 804 Bay Ln NE
- 3803 N Nokomis NE
- 806 Bay Ln NE
- 101 Three Havens Dr NE
- 3900 N Nokomis NE
- TBD NE Bay Ln
- 807 Bay Ln NE
- 3801 N Nokomis NE
- 808 Bay Ln NE
- 3904 Cty Road 42 NE
- 3904 County Road 42 NE
- 3711 N Nokomis NE
- 902 Bay Ln NE
- 3907 County Road 42 NE
- 211 Three Havens Dr NE
- 102 Three Havens Dr NE
- 102 Three Havens Dr NE
- 904 Bay Ln NE