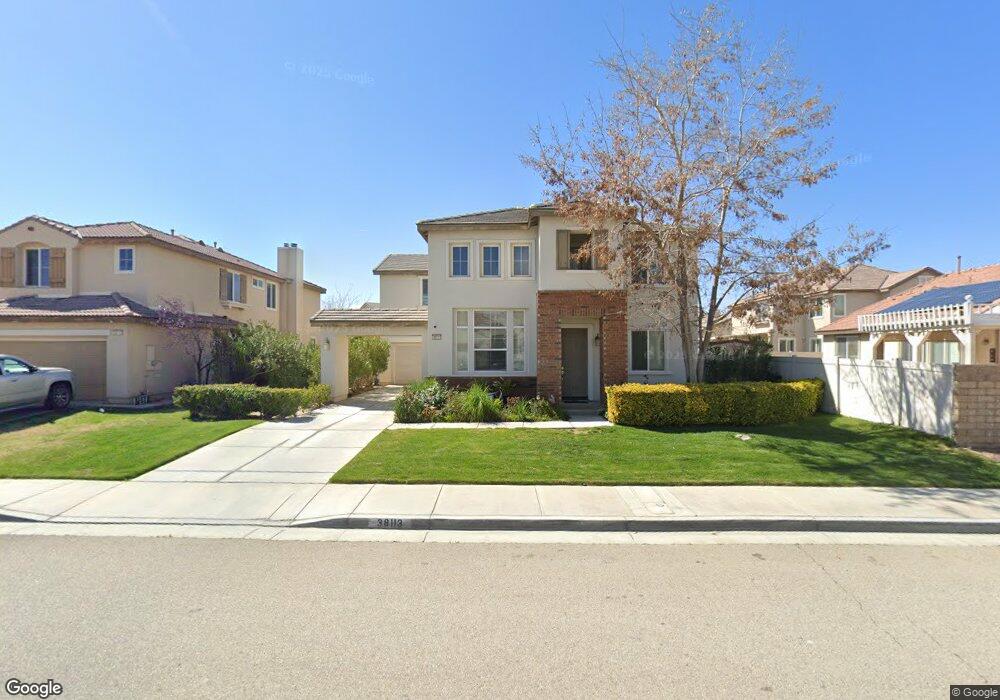
38113 Trilport Ave Palmdale, CA 93552
East Palmdale NeighborhoodEstimated Value: $559,000 - $603,000
4
Beds
4
Baths
2,867
Sq Ft
$201/Sq Ft
Est. Value
About This Home
This home is located at 38113 Trilport Ave, Palmdale, CA 93552 and is currently estimated at $575,460, approximately $200 per square foot. 38113 Trilport Ave is a home located in Los Angeles County with nearby schools including Golden Poppy Elementary School, Shadow Hills Middle School, and Knight High School.
Ownership History
Date
Name
Owned For
Owner Type
Purchase Details
Closed on
Nov 14, 2024
Sold by
Hargrove Pamela L
Bought by
Pamela Hargrove 2024 Trust and Hargrove
Current Estimated Value
Purchase Details
Closed on
Nov 16, 2009
Sold by
Rajagopal Hemalatha and Ramachandran Rajanbabu
Bought by
Hargrove Pamela
Home Financials for this Owner
Home Financials are based on the most recent Mortgage that was taken out on this home.
Original Mortgage
$181,649
Interest Rate
4.88%
Mortgage Type
FHA
Purchase Details
Closed on
May 16, 2006
Sold by
Pulte Home Corp
Bought by
Rajagopal Hemalatha
Home Financials for this Owner
Home Financials are based on the most recent Mortgage that was taken out on this home.
Original Mortgage
$346,600
Interest Rate
6.75%
Mortgage Type
Fannie Mae Freddie Mac
Create a Home Valuation Report for This Property
The Home Valuation Report is an in-depth analysis detailing your home's value as well as a comparison with similar homes in the area
Home Values in the Area
Average Home Value in this Area
Purchase History
| Date | Buyer | Sale Price | Title Company |
|---|---|---|---|
| Pamela Hargrove 2024 Trust | -- | None Listed On Document | |
| Pamela Hargrove 2024 Trust | -- | None Listed On Document | |
| Hargrove Pamela | $185,000 | Fatcola | |
| Rajagopal Hemalatha | $433,500 | First American Title Co |
Source: Public Records
Mortgage History
| Date | Status | Borrower | Loan Amount |
|---|---|---|---|
| Previous Owner | Hargrove Pamela | $181,649 | |
| Previous Owner | Rajagopal Hemalatha | $346,600 |
Source: Public Records
Tax History Compared to Growth
Tax History
| Year | Tax Paid | Tax Assessment Tax Assessment Total Assessment is a certain percentage of the fair market value that is determined by local assessors to be the total taxable value of land and additions on the property. | Land | Improvement |
|---|---|---|---|---|
| 2025 | $5,624 | $238,785 | $47,751 | $191,034 |
| 2024 | $5,624 | $234,104 | $46,815 | $187,289 |
| 2023 | $5,557 | $229,515 | $45,898 | $183,617 |
| 2022 | $5,363 | $225,016 | $44,999 | $180,017 |
| 2021 | $5,224 | $220,605 | $44,117 | $176,488 |
| 2019 | $5,054 | $214,063 | $42,809 | $171,254 |
| 2018 | $4,970 | $209,867 | $41,970 | $167,897 |
| 2016 | $4,656 | $201,720 | $40,342 | $161,378 |
| 2015 | $4,603 | $198,691 | $39,737 | $158,954 |
| 2014 | $4,548 | $194,800 | $38,959 | $155,841 |
Source: Public Records
Map
Nearby Homes
- 38063 Versailles St
- 6614 Lasseron Dr
- 6626 Campbell St
- 6810 Evans St
- 38227 Duval Ct
- 39059 Calmview Cir
- 1887 Vincent Dr
- 6550 Bicknell Ct
- 38015 65th St E Unit Spc A1
- 38015 65th St E Unit D5
- 1 70th St E Near Avenue Q10
- 37762 67th St E
- 38244 Armstrong Dr
- 9044 E Palmdale Blvd
- 6625 Avenida de Camino
- 37732 Phelan Ln
- 0 Vic Avenue R Vic 65th Ste Unit 25002386
- 38132 Ranger Dr
- 0 65th St East Near Ave R-4 Unit 24007291
- 38118 Pioneer Dr
- 38103 Trilport Ave
- 6734 Brion Ct
- 6722 Brion Ct
- 38065 Trilport Ave
- 6714 Brion Ct
- 6715 Tende St
- 38068 Valberg St
- 38110 Trilport Ave
- 38118 Trilport Ave
- 38102 Trilport Ave
- 38055 Trilport Ave
- 38126 Trilport Ave
- 6706 Brion Ct
- 38066 Trilport Ave
- 6701 Tende St
- 38056 Valberg St
- 38136 Trilport Ave
- 38043 Trilport Ave
- 38056 Trilport Ave
- 6737 Brion Ct