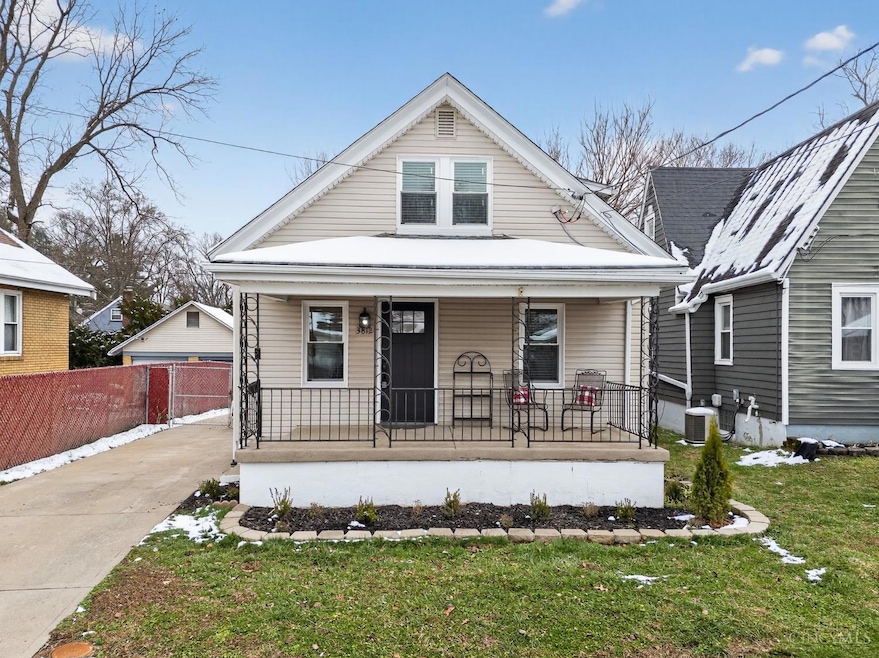
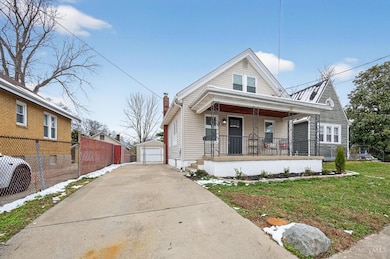
3812 Carlton St Cincinnati, OH 45227
Estimated payment $2,381/month
Highlights
- Cape Cod Architecture
- Main Floor Bedroom
- No HOA
- Terrace Park Elementary School Rated A+
- Quartz Countertops
- 1 Car Detached Garage
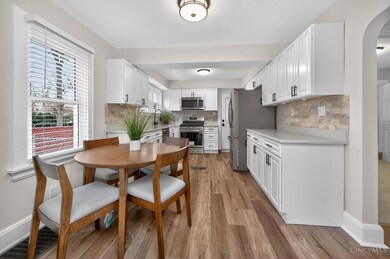
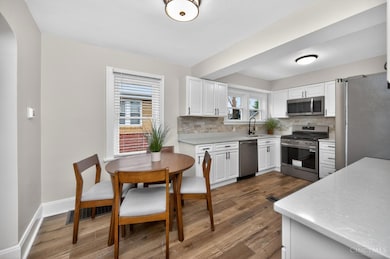
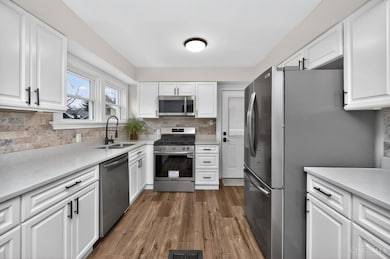
About This Home
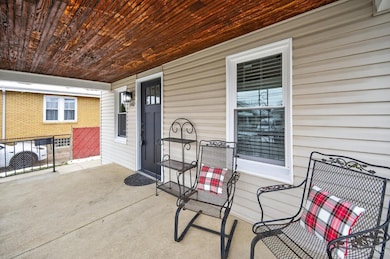
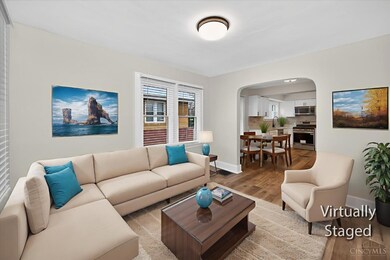
Beautifully remodeled from top to bottom, this charming home in the Village of Fairfax offers the perfect blend of modern comfort and classic appealall within the Mariemont School District. Enjoy peace of mind with a brand new roof, AC, energy-efficient windows, and stunning updates throughout. The gorgeous kitchen features quartz countertops, a travertine backsplash, new cabinets, and all new appliances. The bathroom has been completely refreshed with slate tile, a new vanity, toilet, and tub. Relax or entertain on the spacious deck overlooking a fenced backyard. With new flooring, finished basement, and an oversized garage with a new remote-controlled door, this home truly feels brand new and ready for you to move right in! Interior Photos coming soon!
Open House Schedule
-
Saturday, December 13, 20253:00 to 5:00 pm12/13/2025 3:00:00 PM +00:0012/13/2025 5:00:00 PM +00:00Add to Calendar
-
Sunday, December 14, 20253:00 to 5:00 pm12/14/2025 3:00:00 PM +00:0012/14/2025 5:00:00 PM +00:00Add to Calendar
Home Details
Home Type
- Single Family
Est. Annual Taxes
- $4,338
Year Built
- Built in 1929
Lot Details
- 4,966 Sq Ft Lot
- Lot Dimensions are 40x125
Parking
- 1 Car Detached Garage
- Oversized Parking
- Driveway
- On-Street Parking
Home Design
- Cape Cod Architecture
- Block Foundation
- Shingle Roof
- Vinyl Siding
Interior Spaces
- 1,377 Sq Ft Home
- 1.5-Story Property
- Low Emissivity Windows
- Vinyl Clad Windows
- Insulated Windows
- Partially Finished Basement
- Basement Fills Entire Space Under The House
Kitchen
- Eat-In Kitchen
- Oven or Range
- Microwave
- Dishwasher
- Quartz Countertops
Flooring
- Laminate
- Tile
Bedrooms and Bathrooms
- 4 Bedrooms
- Main Floor Bedroom
- Bathtub with Shower
Outdoor Features
- Covered Deck
Utilities
- Forced Air Heating and Cooling System
- Heating System Uses Gas
- Gas Water Heater
Community Details
- No Home Owners Association
Map
Home Values in the Area
Average Home Value in this Area
Tax History
| Year | Tax Paid | Tax Assessment Tax Assessment Total Assessment is a certain percentage of the fair market value that is determined by local assessors to be the total taxable value of land and additions on the property. | Land | Improvement |
|---|---|---|---|---|
| 2024 | $4,338 | $58,965 | $20,136 | $38,829 |
| 2023 | $4,022 | $58,965 | $20,136 | $38,829 |
| 2022 | $3,648 | $44,332 | $10,812 | $33,520 |
| 2021 | $3,491 | $44,332 | $10,812 | $33,520 |
| 2020 | $3,526 | $44,332 | $10,812 | $33,520 |
| 2019 | $3,449 | $39,232 | $9,569 | $29,663 |
| 2018 | $3,369 | $39,232 | $9,569 | $29,663 |
| 2017 | $2,896 | $39,232 | $9,569 | $29,663 |
| 2016 | $2,769 | $35,987 | $9,562 | $26,425 |
| 2015 | $2,761 | $35,987 | $9,562 | $26,425 |
| 2014 | $2,770 | $35,987 | $9,562 | $26,425 |
| 2013 | $2,561 | $34,937 | $9,282 | $25,655 |
Property History
| Date | Event | Price | List to Sale | Price per Sq Ft |
|---|---|---|---|---|
| 12/05/2025 12/05/25 | For Sale | $385,000 | -- | $280 / Sq Ft |
Purchase History
| Date | Type | Sale Price | Title Company |
|---|---|---|---|
| Warranty Deed | $155,000 | Columbia Title | |
| Certificate Of Transfer | -- | None Available |
Source: MLS of Greater Cincinnati (CincyMLS)
MLS Number: 1863548
APN: 523-0006-0345
Disclaimer: Certain information contained herein is derived from information provided by parties other than Homes.com. All information provided is deemed reliable, but is not guaranteed to be accurate and should be independently verified.
![]() The data relating to real estate for sale on this website comes in part from the Broker Reciprocity programs of the MLS of Greater Cincinnati, Inc.. Those listings held by brokerage firms other than Ten-X are marked with the Broker Reciprocity logo and house icon. The properties displayed may not be all of the properties available through Broker Reciprocity.
The data relating to real estate for sale on this website comes in part from the Broker Reciprocity programs of the MLS of Greater Cincinnati, Inc.. Those listings held by brokerage firms other than Ten-X are marked with the Broker Reciprocity logo and house icon. The properties displayed may not be all of the properties available through Broker Reciprocity.
IDX information is provided exclusively for personal, non-commercial use, and may not be used for any purpose other than to identify prospective properties consumers may be interested in purchasing.
Information is deemed reliable but not guaranteed.
Ten-X does not display the entire Cincinnati MLS Broker Reciprocity™ database on this web site. The listings of some real estate brokerage firms have been excluded.
Copyright 2025, MLS of Greater Cincinnati, Inc. All rights reserved
- 6219 Bedford St
- 6208 Bancroft St
- 3815 Watterson Rd
- 3690 Birkdale Ln
- St Martin Plan at Birkdale
- 3645 Birkdale Ln
- 3674 Birkdale Ln
- 6576 Wooster Pike
- 3670 Birkdale Ln
- 3662 Birkdale Ln
- 6510 Murray Ave
- 5809 Elder St
- 3726 Southern Ave
- 3806 Southern Ave
- 4115 Homer Ave
- 3986 S Whetzel Ave
- 6417 Bramble Ave
- 3795 Meadowlark Ln
- 3805 Meadowlark Ln
- 6001 Bramble Ave
- 3869 Beech St
- 3919 Beech St
- 3988 S Whetzel St
- 6628 Murray Ave
- 4216 Settle St Unit 2
- 6707-C Murray Ave
- 3987 Germania St
- 6101 Bramble Ave
- 6622 Bramble Ave
- 4403 Simpson Ave
- 5651 Bramble Ave Unit 1
- 6632 Roe St
- 5508 Arnsby Place Unit 1
- 6965 Thorndike Rd
- 6931 Merwin Ave
- 5639 Macey Ave
- 4209 Erie Ave
- 4478 Butterfield Place
- 4480 Butterfield Place
- 4932 Roanoke St
