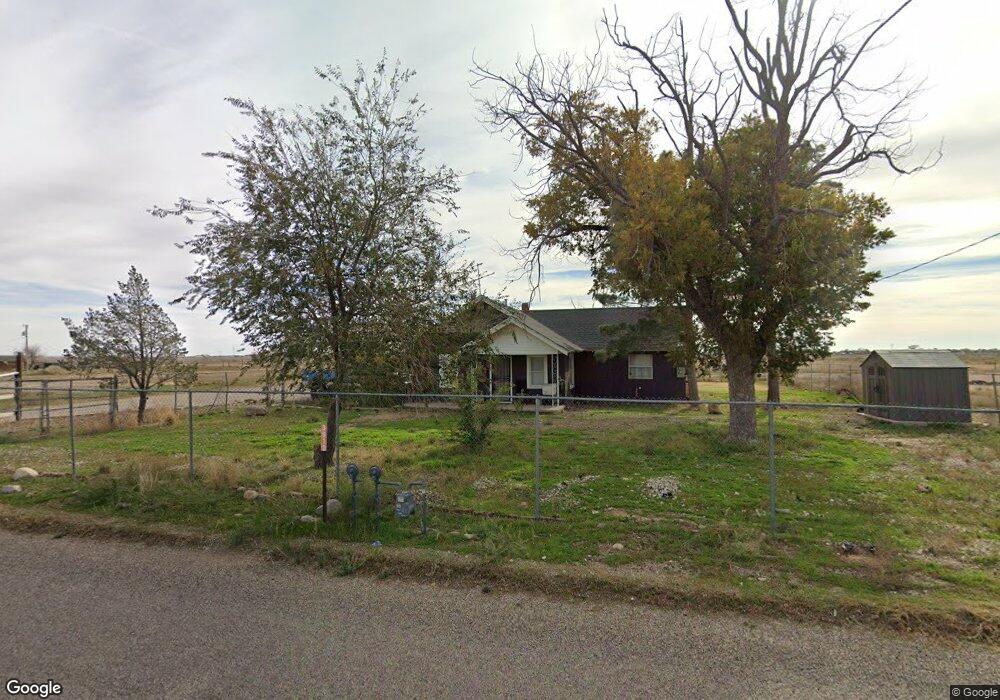
3812 E Crossroads Roswell, NM 88203
Estimated Value: $240,000 - $269,000
Studio
--
Bath
1,404
Sq Ft
$180/Sq Ft
Est. Value
About This Home
This home is located at 3812 E Crossroads, Roswell, NM 88203 and is currently estimated at $252,927, approximately $180 per square foot. 3812 E Crossroads is a home located in Chaves County with nearby schools including East Grand Plains Elementary School, Mountain View Middle School, and Early College High School.
Ownership History
Date
Name
Owned For
Owner Type
Purchase Details
Closed on
Feb 17, 2023
Sold by
Sanchez Gloria
Bought by
Ford Ciera J
Current Estimated Value
Home Financials for this Owner
Home Financials are based on the most recent Mortgage that was taken out on this home.
Original Mortgage
$157,140
Outstanding Balance
$152,342
Interest Rate
6.48%
Mortgage Type
New Conventional
Estimated Equity
$100,585
Purchase Details
Closed on
Mar 11, 2021
Sold by
Campanella James and Campanella Dixi
Bought by
Sanchez Gloria
Home Financials for this Owner
Home Financials are based on the most recent Mortgage that was taken out on this home.
Original Mortgage
$53,583
Interest Rate
2.7%
Mortgage Type
Credit Line Revolving
Purchase Details
Closed on
Apr 2, 2018
Sold by
Smith Adrianna
Bought by
Campanella James and Campanella Dixie
Purchase Details
Closed on
Mar 11, 2008
Sold by
Yarborough James W and Yarborough Sandra K
Bought by
Smith Adrianna
Create a Home Valuation Report for This Property
The Home Valuation Report is an in-depth analysis detailing your home's value as well as a comparison with similar homes in the area
Purchase History
| Date | Buyer | Sale Price | Title Company |
|---|---|---|---|
| Ford Ciera J | -- | Fidelity National Title | |
| Sanchez Gloria | -- | Fidelity National Ttl Ins Co | |
| Campanella James | $63,250 | None Available | |
| Smith Adrianna | -- | None Available | |
| Smith Adrianna | -- | None Available |
Source: Public Records
Mortgage History
| Date | Status | Borrower | Loan Amount |
|---|---|---|---|
| Open | Ford Ciera J | $157,140 | |
| Previous Owner | Sanchez Gloria | $53,583 |
Source: Public Records
Tax History
| Year | Tax Paid | Tax Assessment Tax Assessment Total Assessment is a certain percentage of the fair market value that is determined by local assessors to be the total taxable value of land and additions on the property. | Land | Improvement |
|---|---|---|---|---|
| 2025 | $1,564 | $71,762 | $6,604 | $65,158 |
| 2024 | $1,564 | $72,471 | $6,604 | $65,867 |
| 2023 | $496 | $22,355 | $6,604 | $15,751 |
| 2022 | $479 | $21,704 | $6,604 | $15,100 |
| 2021 | $516 | $23,364 | $6,604 | $16,760 |
| 2020 | $513 | $23,214 | $6,604 | $16,610 |
| 2019 | $530 | $24,008 | $6,604 | $17,404 |
| 2018 | $600 | $27,277 | $6,604 | $20,673 |
| 2017 | $620 | $28,361 | $4,392 | $23,969 |
| 2016 | $596 | $27,535 | $2,972 | $24,563 |
| 2015 | $665 | $27,505 | $2,972 | $24,533 |
| 2014 | $1,292 | $26,704 | $2,972 | $23,732 |
Source: Public Records
Map
Nearby Homes
- 0 Tumbleweed Rd
- 3894 E Hobson Rd
- 29 E Phoenix Rd
- 5605 Old Dexter Hwy
- 6649 Russell Rd
- 6662 Dakota Rd
- 25 Carrol St
- 42 Lansing Rd
- 3982 S Springs Loop
- 3950 Cottonwood Ln
- 00 E Hobson Rd
- 3968 S Spring Loop
- Near 2 E Anasazi Rd
- 15 Richmond Rd
- 12 Murphy Place
- 2580 Milky Way Rd
- 30 E Byrne St
- 79 Gail Harris St
- 00 Hamill Rd St
- 5000 S Main St
- 3804 E Crossroads
- 3820 E Crossroads
- 6291 S Hummingbird Ln
- 3826 E Crossroads
- 3826 E Crossroads
- 3832 E Crossroads
- 00 Maya Rd
- 6317 Maya Rd
- 3798 E Crossroads
- 3796 E Crossroads
- 3784 E Crossroads
- 6326 Corn Rd
- 6333 Corn Rd
- 3780 E Crossroads
- 3778 E Crossroads
- 335 Tumbleweed Rd
- 3774 E Crossroads
- 3768 E Crossroads
- 3766 E Crossroads
- 6249 S Hummingbird Ln
Your Personal Tour Guide
Ask me questions while you tour the home.