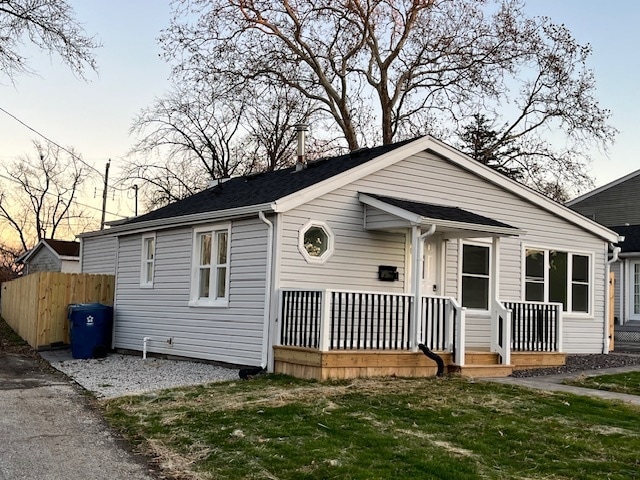
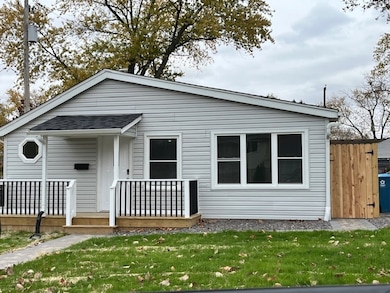
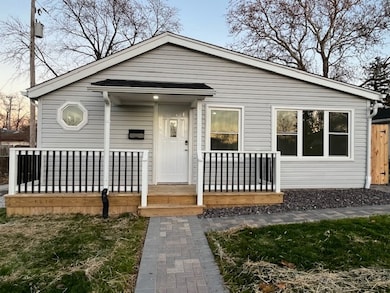
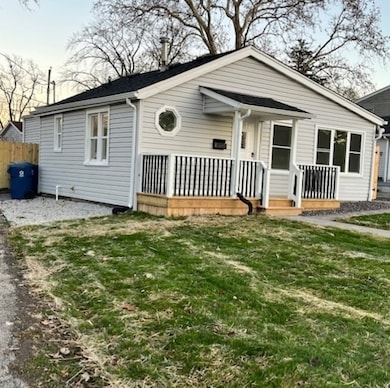
3813 Morgan St Steger, IL 60475
Estimated payment $1,321/month
Highlights
- Deck
- Den
- Living Room
- Ranch Style House
- Formal Dining Room
- Laundry Room
About This Home
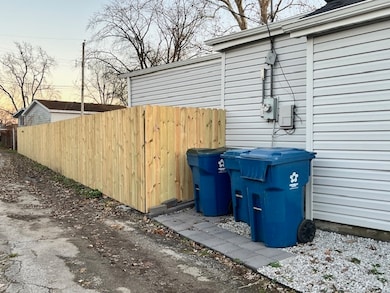
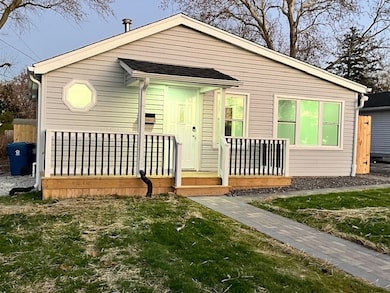
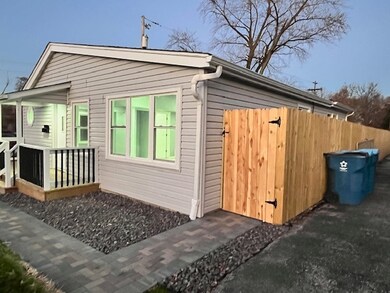
****HAPPY HOLIDAYS FROM OUR HOME TO YOURS****If you're looking for a home ready to move in and enjoy the holidays with nothing to do but decorate your home, here it is. The seller wanted to make sure the home is prepared to handle whatever old man winter has to throw at you. The home was completely gutted in 2024, the furnace works great. Let's start from the bottom up, it has a new crawl space post for support, the drains go under the house out to the alley so you will not have any moisture, it has a newly installed French drain sump pump and a 10 mm black plastic sheet for moisture resistance. It has new copper water lines, new black gas lines, and new PVC lines. It has R-13 fiberglass insulation throughout the whole house. New vinyl flooring, new doors with hardware, sensor lights in the closets and laundry room, new kitchen cabinets and counter top, new canned lighting, new outlets, and new light fixtures, new bathroom with custom stand up shower and glass sliding doors. Hot Water Tank also (2025), now for the exterior of the home, some new windows, new entry doors, the decorative brick pavers around the front and side walk way of the home. New roof and new gutters angled to allow rain to go out, NEW siding around whole house (2025) NEW front (5x15) and rear decks (15x30) both 2025 and the NEW wood treated privacy fence around the home (2025) Roof (2025) Home is near schools, parks, and highways.
Listing Agent
Charles Rutenberg Realty of IL License #475164716 Listed on: 12/06/2025

Home Details
Home Type
- Single Family
Est. Annual Taxes
- $3,896
Year Built
- Built in 1942 | Remodeled in 2025
Lot Details
- Lot Dimensions are 41x136
- Irregular Lot
Home Design
- Ranch Style House
- Asphalt Roof
Interior Spaces
- 1,135 Sq Ft Home
- Family Room
- Living Room
- Formal Dining Room
- Den
- Vinyl Flooring
- Laundry Room
Bedrooms and Bathrooms
- 2 Bedrooms
- 2 Potential Bedrooms
- 1 Full Bathroom
Parking
- 4 Parking Spaces
- Parking Included in Price
Outdoor Features
- Deck
Utilities
- Heating System Uses Natural Gas
- Lake Michigan Water
Map
Home Values in the Area
Average Home Value in this Area
Tax History
| Year | Tax Paid | Tax Assessment Tax Assessment Total Assessment is a certain percentage of the fair market value that is determined by local assessors to be the total taxable value of land and additions on the property. | Land | Improvement |
|---|---|---|---|---|
| 2024 | $3,896 | $37,663 | $5,402 | $32,261 |
| 2023 | $3,896 | $33,631 | $4,824 | $28,807 |
| 2022 | $3,402 | $29,889 | $4,287 | $25,602 |
| 2021 | $3,221 | $27,366 | $3,925 | $23,441 |
| 2020 | $3,127 | $25,648 | $3,679 | $21,969 |
| 2019 | $2,987 | $24,106 | $3,458 | $20,648 |
| 2018 | $2,884 | $23,588 | $3,384 | $20,204 |
| 2017 | $2,856 | $21,730 | $3,117 | $18,613 |
| 2016 | $3,007 | $21,590 | $3,097 | $18,493 |
| 2015 | $2,930 | $21,012 | $3,014 | $17,998 |
| 2014 | $2,930 | $21,224 | $3,044 | $18,180 |
| 2013 | $2,930 | $22,241 | $3,190 | $19,051 |
Property History
| Date | Event | Price | List to Sale | Price per Sq Ft |
|---|---|---|---|---|
| 12/06/2025 12/06/25 | For Sale | $189,914 | -- | $167 / Sq Ft |
Purchase History
| Date | Type | Sale Price | Title Company |
|---|---|---|---|
| Warranty Deed | $54,000 | First American Title | |
| Interfamily Deed Transfer | -- | Resource Title Llc | |
| Interfamily Deed Transfer | -- | -- | |
| Warranty Deed | $64,000 | -- | |
| Deed | $51,000 | -- |
Mortgage History
| Date | Status | Loan Amount | Loan Type |
|---|---|---|---|
| Previous Owner | $61,200 | New Conventional | |
| Previous Owner | $63,957 | FHA |
Source: Midwest Real Estate Data (MRED)
MLS Number: 12529043
APN: 23-15-05-307-012
Disclaimer: Certain information contained herein is derived from information provided by parties other than Homes.com. All information provided is deemed reliable, but is not guaranteed to be accurate and should be independently verified.
![]() Based on information submitted to the MLS GRID. All data is obtained from various sources and may not have been verified by broker or MLS GRID. Supplied Open House Information is subject to change without notice. All information should be independently reviewed and verified for accuracy. Properties may or may not be listed by the office/agent presenting the information. Some IDX listings have been excluded from this website.
Based on information submitted to the MLS GRID. All data is obtained from various sources and may not have been verified by broker or MLS GRID. Supplied Open House Information is subject to change without notice. All information should be independently reviewed and verified for accuracy. Properties may or may not be listed by the office/agent presenting the information. Some IDX listings have been excluded from this website.
The Digital Millennium Copyright Act of 1998, 17 U.S.C. § 512 (the “DMCA”) provides recourse for copyright owners who believe that material appearing on the Internet infringes their rights under U.S. copyright law. If you believe in good faith that any content or material made available in connection with our website or services infringes your copyright, you (or your agent) may send us a notice requesting that the content or material be removed, or access to it blocked.
Notices must be sent in writing by email to DMCAnotice@MLSGrid.com.
The DMCA requires that your notice of alleged copyright infringement include the following information:
(1) description of the copyrighted work that is the subject of claimed infringement;
(2) description of the alleged infringing content and information sufficient to permit us to locate the content;
(3) contact information for you, including your address, telephone number and email address;
(4) a statement by you that you have a good faith belief that the content in the manner complained of is not authorized by the copyright owner, or its agent, or by the operation of any law;
(5) a statement by you, signed under penalty of perjury, that the information in the notification is accurate and that you have the authority to enforce the copyrights that are claimed to be infringed; and
(6) a physical or electronic signature of the copyright owner or a person authorized to act on the copyright owner’s behalf. Failure to include all of the above information may result in the delay of the processing of your complaint.
- 173 Cedarwood Dr
- 186 Cedarwood Dr
- 188 Cedarwood Dr
- 23751 S Loomis St
- 200 Crystal Ln
- 92 W 37th St
- 3622 Morgan St
- 23627 S Ashland Ave
- 39 Mckinley Ave
- 23715 S Ashland Ave
- 23614 S Ashland Ave
- 3541 Peoria St
- 3533 Ashland Ave
- 3606 Emerald Ave
- 3728 Chicago Rd
- 3706 Chicago Rd
- 3512 John St
- 3502 Morgan St
- 3505 Peoria St
- 23810 S Ashland Ave
- 3529 Carpenter St
- 3726 Union Ave
- 316 W 34th St
- 10 W 33rd Place Unit 2W
- 17 W 30th Place
- 3002 Green St
- 3002 Green St Unit 1
- 3002 Green St Unit 2
- 3353 Commercial Ave Unit 14
- 3343 Commercial Ave Unit 2
- 3341 Commercial Ave
- 3341 Commercial Ave Unit 21
- 23433-23451 S Western Ave
- 28 Dunlap Rd
- 3484 Western Ave Unit 3484-B
- 21 Indianwood Blvd Unit 206
- 41 Indianwood Blvd Unit 178
- 3324 Western Ave
- 344 Nassau St
- 759 Burr Oak Ln