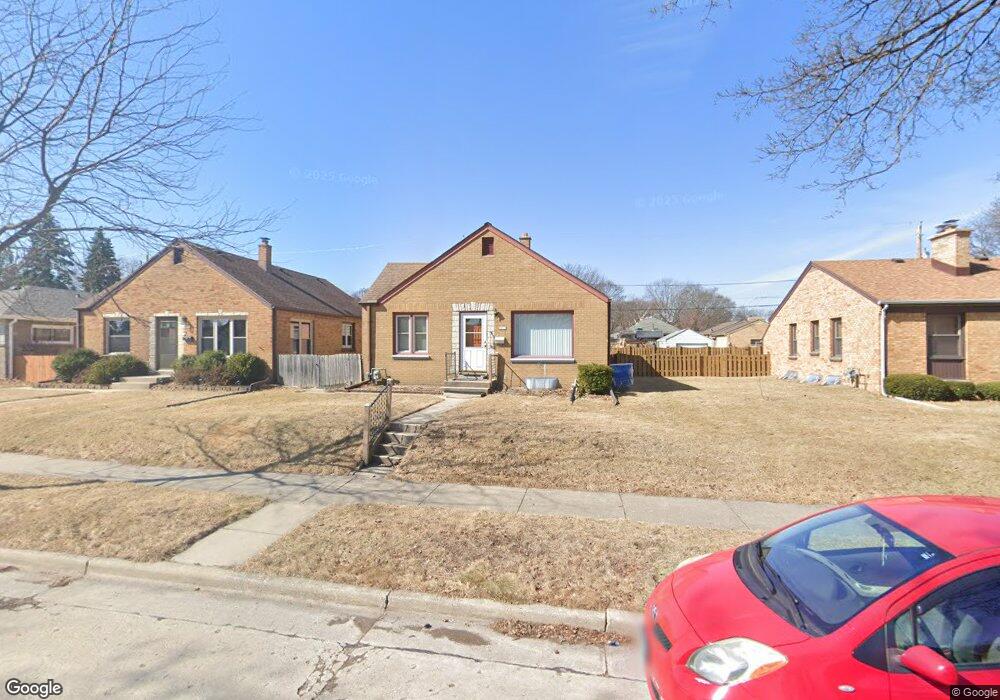
3813 S 52nd St Milwaukee, WI 53220
Honey Creek Manor NeighborhoodEstimated Value: $263,000 - $273,246
3
Beds
1
Bath
1,007
Sq Ft
$265/Sq Ft
Est. Value
About This Home
This home is located at 3813 S 52nd St, Milwaukee, WI 53220 and is currently estimated at $267,312, approximately $265 per square foot. 3813 S 52nd St is a home located in Milwaukee County with nearby schools including Milwaukee Spanish Immersion School - Upper Campus, Milwaukee German Immersion School, and Craig Montessori School.
Ownership History
Date
Name
Owned For
Owner Type
Purchase Details
Closed on
Aug 12, 2015
Sold by
Stojsavljevic Milutin
Bought by
Stojsavljevic Milos and Stojsavljevic Zoran
Current Estimated Value
Purchase Details
Closed on
Sep 29, 2014
Sold by
Hayes Meta M
Bought by
Stojsavljevic Milutin
Purchase Details
Closed on
Apr 11, 2014
Sold by
Gronkowski Christine
Bought by
Hayes Meta M
Home Financials for this Owner
Home Financials are based on the most recent Mortgage that was taken out on this home.
Original Mortgage
$81,000
Interest Rate
4.41%
Mortgage Type
New Conventional
Purchase Details
Closed on
Apr 29, 1996
Sold by
Mielcarek Gail V and Hoagland Gail V
Bought by
Gronkowski Casimir and Gronkowski Christine
Home Financials for this Owner
Home Financials are based on the most recent Mortgage that was taken out on this home.
Original Mortgage
$45,000
Interest Rate
7.99%
Mortgage Type
Purchase Money Mortgage
Create a Home Valuation Report for This Property
The Home Valuation Report is an in-depth analysis detailing your home's value as well as a comparison with similar homes in the area
Home Values in the Area
Average Home Value in this Area
Purchase History
| Date | Buyer | Sale Price | Title Company |
|---|---|---|---|
| Stojsavljevic Milos | -- | Attorney | |
| Stojsavljevic Milutin | $113,000 | -- | |
| Hayes Meta M | $108,000 | None Available | |
| Gronkowski Casimir | $85,000 | -- |
Source: Public Records
Mortgage History
| Date | Status | Borrower | Loan Amount |
|---|---|---|---|
| Previous Owner | Hayes Meta M | $81,000 | |
| Previous Owner | Gronkowski Casimir | $45,000 |
Source: Public Records
Tax History Compared to Growth
Tax History
| Year | Tax Paid | Tax Assessment Tax Assessment Total Assessment is a certain percentage of the fair market value that is determined by local assessors to be the total taxable value of land and additions on the property. | Land | Improvement |
|---|---|---|---|---|
| 2024 | $4,133 | $196,300 | $37,000 | $159,300 |
| 2023 | $3,927 | $166,200 | $37,000 | $129,200 |
| 2022 | $3,642 | $166,200 | $37,000 | $129,200 |
| 2021 | $3,460 | $143,700 | $34,600 | $109,100 |
| 2020 | $3,502 | $143,700 | $34,600 | $109,100 |
| 2019 | $3,114 | $127,900 | $36,000 | $91,900 |
| 2018 | $3,079 | $127,900 | $36,000 | $91,900 |
| 2017 | $3,154 | $123,000 | $40,400 | $82,600 |
| 2016 | $3,146 | $117,200 | $40,400 | $76,800 |
| 2015 | $3,229 | $117,200 | $40,400 | $76,800 |
| 2014 | $3,371 | $119,700 | $40,400 | $79,300 |
| 2013 | -- | $119,700 | $40,400 | $79,300 |
Source: Public Records
Map
Nearby Homes
- 5326 W Crawford Ave
- 5322 W van Beck Ave
- 5062 W Colonial Ct Unit 14
- 4928 W van Beck Ave
- 3676 S 53rd St
- 3616 S 53rd St
- 3731 S 56th St
- 3741 S 47th St
- 5600 W Forest Home Ave
- 5538 W Forest Home Ave
- 4531 W Tripoli Ave Unit 4533
- 4037 S 58th St
- 4508 W Crawford Ave
- 4168 S 55th St
- 4502 W Crawford Ave
- 3632 S 60th St
- 4034 S 60th St
- 4420 W van Beck Ave
- 5508 W Morgan Ave
- 3521 S 58th St
- 3819 S 52nd St
- 3805 S 52nd St
- 3825 S 52nd St
- 3829 S 52nd St
- 3812 S 53rd St
- 3808 S 53rd St
- 3818 S 53rd St
- 3800 S 53rd St
- 3833 S 52nd St
- 3822 S 53rd St
- 3822 S 53rd St Unit 3822A
- 3814 S 52nd St
- 3828 S 53rd St
- 3806 S 52nd St
- 3777 S 52nd St
- 3822 S 52nd St
- 3839 S 52nd St
- 3800 S 52nd St
- 3834 S 53rd St
- 3828 S 52nd St