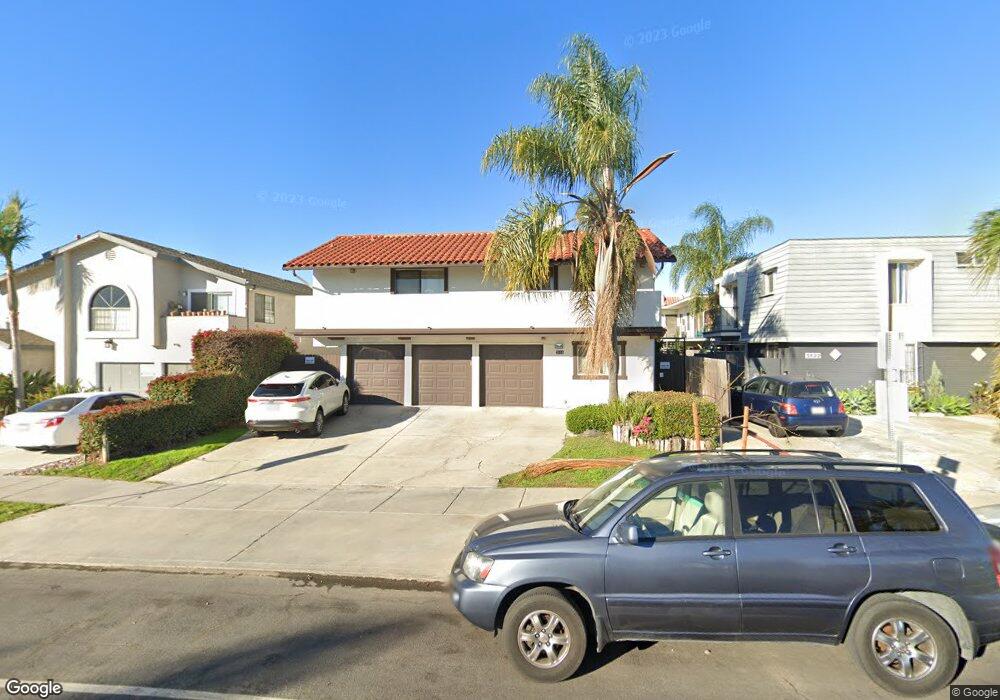
3814 35th St Unit 3 San Diego, CA 92104
Cherokee Point NeighborhoodEstimated Value: $401,899 - $528,000
2
Beds
1
Bath
748
Sq Ft
$654/Sq Ft
Est. Value
About This Home
This home is located at 3814 35th St Unit 3, San Diego, CA 92104 and is currently estimated at $489,225, approximately $654 per square foot. 3814 35th St Unit 3 is a home located in San Diego County with nearby schools including Cherokee Point Elementary School, Wilson Middle School, and Herbert Hoover High School.
Ownership History
Date
Name
Owned For
Owner Type
Purchase Details
Closed on
Nov 29, 1995
Sold by
Hud
Bought by
Lacaille Craig L
Current Estimated Value
Home Financials for this Owner
Home Financials are based on the most recent Mortgage that was taken out on this home.
Original Mortgage
$19,800
Outstanding Balance
$405
Interest Rate
7.37%
Estimated Equity
$488,820
Purchase Details
Closed on
Jul 6, 1995
Sold by
National Bank Of Southern California
Bought by
Hud
Purchase Details
Closed on
Jun 27, 1995
Sold by
Miller Raymond D and Miller Gina L
Bought by
National Bank Of Southern California
Purchase Details
Closed on
Jan 11, 1994
Sold by
Pho Corp
Bought by
Aquino Carlos Francisco
Purchase Details
Closed on
Aug 27, 1993
Sold by
Miller Raymond D and Miller Gina L
Bought by
Pho Corp
Purchase Details
Closed on
Apr 1, 1987
Create a Home Valuation Report for This Property
The Home Valuation Report is an in-depth analysis detailing your home's value as well as a comparison with similar homes in the area
Home Values in the Area
Average Home Value in this Area
Purchase History
| Date | Buyer | Sale Price | Title Company |
|---|---|---|---|
| Lacaille Craig L | $25,000 | Southland Title | |
| Hud | -- | Fidelity National Title | |
| National Bank Of Southern California | $60,733 | Fidelity National Title | |
| Aquino Carlos Francisco | -- | Fidelity National Title | |
| Pho Corp | -- | Fidelity National Title | |
| -- | $56,000 | -- |
Source: Public Records
Mortgage History
| Date | Status | Borrower | Loan Amount |
|---|---|---|---|
| Open | Lacaille Craig L | $19,800 |
Source: Public Records
Tax History Compared to Growth
Tax History
| Year | Tax Paid | Tax Assessment Tax Assessment Total Assessment is a certain percentage of the fair market value that is determined by local assessors to be the total taxable value of land and additions on the property. | Land | Improvement |
|---|---|---|---|---|
| 2025 | $436 | $40,665 | $16,596 | $24,069 |
| 2024 | $436 | $39,869 | $16,271 | $23,598 |
| 2023 | $424 | $39,088 | $15,952 | $23,136 |
| 2022 | $411 | $38,323 | $15,640 | $22,683 |
| 2021 | $407 | $37,573 | $15,334 | $22,239 |
| 2020 | $402 | $37,188 | $15,177 | $22,011 |
| 2019 | $393 | $36,460 | $14,880 | $21,580 |
| 2018 | $368 | $35,746 | $14,589 | $21,157 |
| 2017 | $357 | $35,046 | $14,303 | $20,743 |
| 2016 | $349 | $34,360 | $14,023 | $20,337 |
| 2015 | $343 | $33,845 | $13,813 | $20,032 |
| 2014 | $337 | $33,183 | $13,543 | $19,640 |
Source: Public Records
Map
Nearby Homes
- 3864 35th St
- 3812-14 36th St
- 3705 Swift Ave
- 4053 Wilson Ave
- 3577-85 Landis St
- 3694 36th St
- 3728 Cherokee Ave
- 3890 37th St
- 0 Boundary St Unit SB25155904
- 4153 Wilson Ave
- 3524-26 36th St
- 4164 Cherokee Ave Unit G
- 3676 Dwight St
- 4171 33rd St
- 3780 32nd St
- 3544 Boundary St
- 3320 Orange Ave
- 4252 35th St Unit 6
- 4041 38th St
- 3421 Vancouver Ave
- 3814 35th St Unit 8
- 3814 35th St Unit 7
- 3814 35th St Unit 5
- 3814 35th St Unit 4
- 3814 35th St Unit 2
- 3814 35th St Unit 1
- 3822 35th St
- 3806 35th St
- 3830 35th St
- 3472 Wightman St
- 3838 35th St
- 3859 35th St
- 3861 35th St
- 3815 Swift Ave
- 3460 Wightman St
- 3809 35th St
- 3835 Swift Ave
- 3794 35th St
- 3473 Wightman St Unit 75
- 3807 Swift Ave