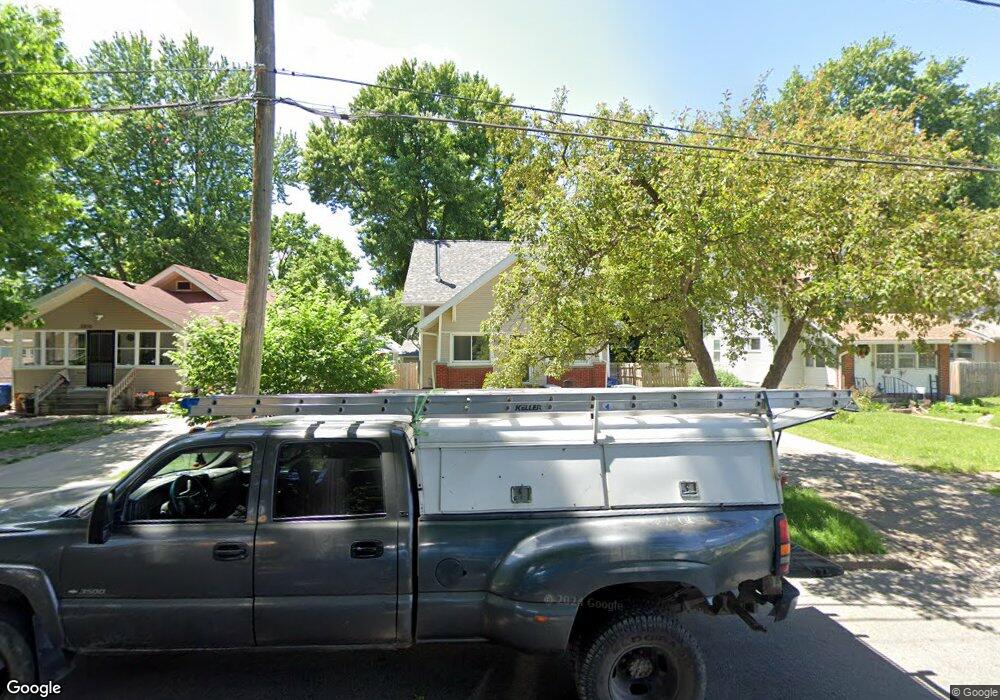
3814 7th St Des Moines, IA 50313
Oak Park NeighborhoodEstimated Value: $132,000 - $170,317
3
Beds
1
Bath
1,186
Sq Ft
$129/Sq Ft
Est. Value
About This Home
This home is located at 3814 7th St, Des Moines, IA 50313 and is currently estimated at $153,079, approximately $129 per square foot. 3814 7th St is a home located in Polk County with nearby schools including Oak Park Elementary School, Harding Middle School, and North High School.
Ownership History
Date
Name
Owned For
Owner Type
Purchase Details
Closed on
Dec 4, 2014
Sold by
Hennessey Christopher J and Hennessey Elizabeth
Bought by
Hennessey Christopher J and Hennessey Elizabeth
Current Estimated Value
Home Financials for this Owner
Home Financials are based on the most recent Mortgage that was taken out on this home.
Original Mortgage
$3,102
Interest Rate
3.99%
Mortgage Type
Unknown
Purchase Details
Closed on
Dec 1, 2005
Sold by
Citifinancial Mortgage Co Inc
Bought by
Hennessey Christopher J
Home Financials for this Owner
Home Financials are based on the most recent Mortgage that was taken out on this home.
Original Mortgage
$10,000
Interest Rate
5.97%
Mortgage Type
Stand Alone Second
Purchase Details
Closed on
Aug 4, 2005
Sold by
Corley Tim and Corley Tina M
Bought by
Citifinancial Mortgage Co Inc
Purchase Details
Closed on
Jun 26, 2000
Sold by
Kelce Donna M
Bought by
Corley Tim and Corley Tina M
Home Financials for this Owner
Home Financials are based on the most recent Mortgage that was taken out on this home.
Original Mortgage
$78,896
Interest Rate
8.56%
Create a Home Valuation Report for This Property
The Home Valuation Report is an in-depth analysis detailing your home's value as well as a comparison with similar homes in the area
Home Values in the Area
Average Home Value in this Area
Purchase History
| Date | Buyer | Sale Price | Title Company |
|---|---|---|---|
| Hennessey Christopher J | -- | None Available | |
| Hennessey Christopher J | $70,500 | -- | |
| Citifinancial Mortgage Co Inc | $67,500 | -- | |
| Corley Tim | $84,500 | -- |
Source: Public Records
Mortgage History
| Date | Status | Borrower | Loan Amount |
|---|---|---|---|
| Closed | Hennessey Christopher J | $3,102 | |
| Closed | Hennessey Christopher J | $11,000 | |
| Closed | Hennessey Christopher J | $10,000 | |
| Open | Hennessey Christopher J | $53,800 | |
| Previous Owner | Corley Tim | $78,896 |
Source: Public Records
Tax History
| Year | Tax Paid | Tax Assessment Tax Assessment Total Assessment is a certain percentage of the fair market value that is determined by local assessors to be the total taxable value of land and additions on the property. | Land | Improvement |
|---|---|---|---|---|
| 2025 | $2,446 | $154,200 | $29,200 | $125,000 |
| 2024 | $2,446 | $134,800 | $25,400 | $109,400 |
| 2023 | $2,322 | $134,800 | $25,400 | $109,400 |
| 2022 | $2,302 | $107,400 | $21,400 | $86,000 |
| 2021 | $2,174 | $107,400 | $21,400 | $86,000 |
| 2020 | $2,252 | $95,700 | $19,200 | $76,500 |
| 2019 | $2,130 | $95,700 | $19,200 | $76,500 |
| 2018 | $2,104 | $87,800 | $17,400 | $70,400 |
| 2017 | $1,928 | $87,800 | $17,400 | $70,400 |
| 2016 | $1,874 | $79,800 | $15,700 | $64,100 |
| 2015 | $1,874 | $79,800 | $15,700 | $64,100 |
| 2014 | $1,772 | $78,100 | $15,200 | $62,900 |
Source: Public Records
Map
Nearby Homes
Your Personal Tour Guide
Ask me questions while you tour the home.