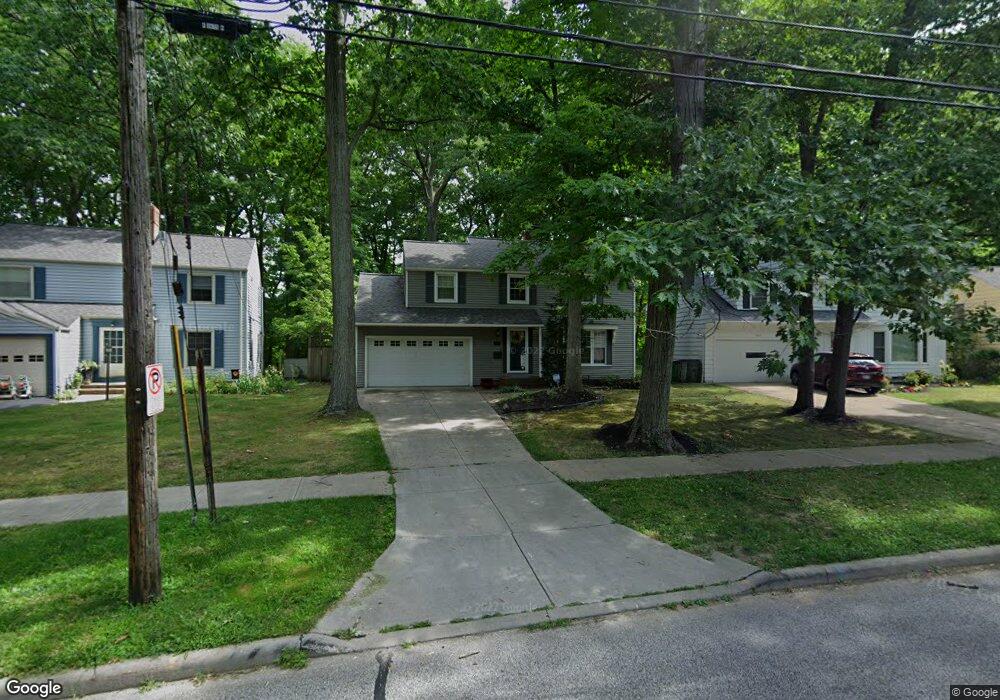
3815 Bridgeview Dr Cleveland, OH 44121
Estimated Value: $205,000 - $215,000
4
Beds
2
Baths
1,862
Sq Ft
$113/Sq Ft
Est. Value
About This Home
This home is located at 3815 Bridgeview Dr, Cleveland, OH 44121 and is currently estimated at $210,124, approximately $112 per square foot. 3815 Bridgeview Dr is a home located in Cuyahoga County with nearby schools including Adrian Elementary School, Greenview Upper Elementary School, and Memorial Junior High School.
Ownership History
Date
Name
Owned For
Owner Type
Purchase Details
Closed on
Jul 18, 2007
Sold by
Gall Mark E and Gall Carol S
Bought by
Miller Wayne and Miller Wesley
Current Estimated Value
Home Financials for this Owner
Home Financials are based on the most recent Mortgage that was taken out on this home.
Original Mortgage
$156,543
Interest Rate
6.31%
Mortgage Type
Purchase Money Mortgage
Purchase Details
Closed on
Jun 18, 1993
Sold by
Gregg Shirley
Bought by
Gall Mark E
Purchase Details
Closed on
Mar 27, 1989
Sold by
Gregg Benjamin A
Bought by
Gregg Shirley
Purchase Details
Closed on
Oct 13, 1976
Sold by
Talbott David W and Talbott Joan F
Bought by
Gregg Benjamin A
Purchase Details
Closed on
Jan 1, 1975
Bought by
Talbott David W and Talbott Joan F
Create a Home Valuation Report for This Property
The Home Valuation Report is an in-depth analysis detailing your home's value as well as a comparison with similar homes in the area
Home Values in the Area
Average Home Value in this Area
Purchase History
| Date | Buyer | Sale Price | Title Company |
|---|---|---|---|
| Miller Wayne | $159,000 | Chicago Title Insurance Co | |
| Gall Mark E | $104,500 | -- | |
| Gregg Shirley | -- | -- | |
| Gregg Benjamin A | $53,000 | -- | |
| Talbott David W | -- | -- |
Source: Public Records
Mortgage History
| Date | Status | Borrower | Loan Amount |
|---|---|---|---|
| Previous Owner | Miller Wayne | $156,543 |
Source: Public Records
Tax History Compared to Growth
Tax History
| Year | Tax Paid | Tax Assessment Tax Assessment Total Assessment is a certain percentage of the fair market value that is determined by local assessors to be the total taxable value of land and additions on the property. | Land | Improvement |
|---|---|---|---|---|
| 2024 | $4,739 | $62,265 | $12,565 | $49,700 |
| 2023 | $4,479 | $47,530 | $9,940 | $37,590 |
| 2022 | $4,455 | $47,530 | $9,940 | $37,590 |
| 2021 | $4,420 | $47,530 | $9,940 | $37,590 |
| 2020 | $4,133 | $38,640 | $8,090 | $30,560 |
| 2019 | $3,771 | $110,400 | $23,100 | $87,300 |
| 2018 | $3,753 | $38,640 | $8,090 | $30,560 |
| 2017 | $4,144 | $39,410 | $6,230 | $33,180 |
| 2016 | $5,443 | $39,410 | $6,230 | $33,180 |
| 2015 | $5,086 | $39,410 | $6,230 | $33,180 |
| 2014 | $5,086 | $41,480 | $6,550 | $34,930 |
Source: Public Records
Map
Nearby Homes
- 3803 Bridgeview Dr
- 2536 Greenvale Rd
- 2545 Greenvale Rd
- 3927 Princeton Blvd
- 693 Quilliams Rd
- 4031 Suffolk Rd
- 3811 Salisbury Rd
- 3595 Runnymede Blvd
- 772 Quilliams Rd
- 3867 Covington Rd
- 2110 Miami Rd
- 3655 Langton Rd
- 18132 Weston Rd
- 3609 Langton Rd
- 855 Roanoke Rd
- 2017 Natona Rd
- 858 Roanoke Rd
- 3598 Atherstone Rd
- 3780 Lowell Rd
- 854 Keystone Dr
- 3811 Bridgeview Dr
- 3819 Bridgeview Dr
- 3807 Bridgeview Dr
- 3823 Bridgeview Dr
- 3827 Bridgeview Dr
- 3805 Bridgeview Dr
- 3810 Bridgeview Dr
- 3808 Bridgeview Dr
- 3831 Bridgeview Dr
- 3806 Bridgeview Dr
- 3804 Bridgeview Dr
- 3797 Bridgeview Dr
- 3815 Princeton Blvd
- 3796 Bridgeview Dr
- 3807 Princeton Blvd
- 3835 Bridgeview Dr
- 3791 Bridgeview Dr
- 3803 Princeton Blvd
- 3792 Bridgeview Dr
- 3841 Bridgeview Dr