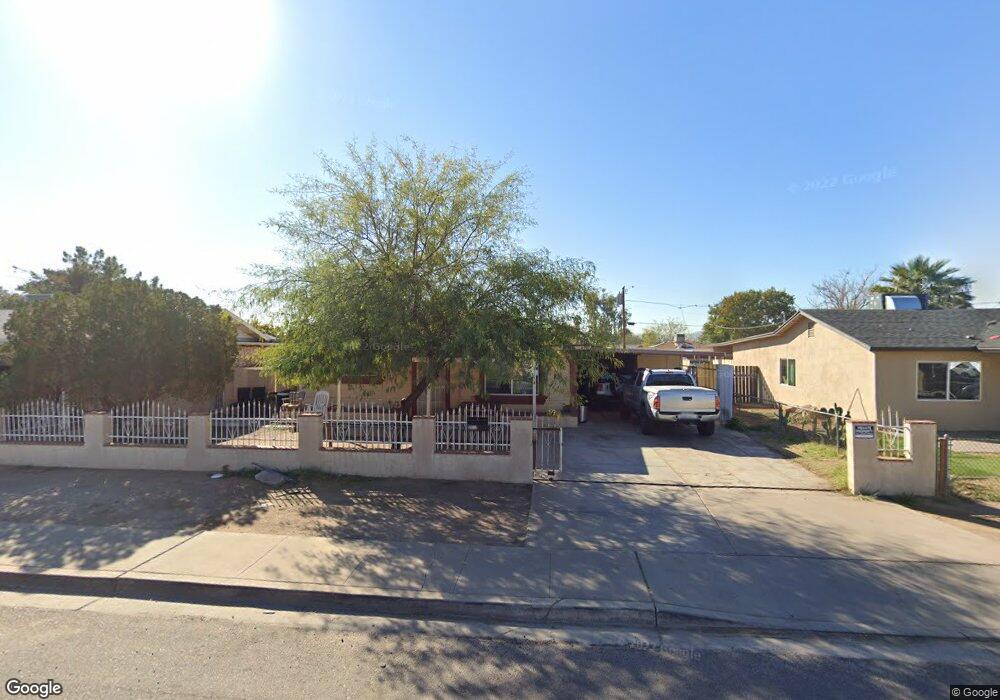
3817 W Fillmore St Phoenix, AZ 85009
Estrella Village NeighborhoodEstimated Value: $208,000 - $291,000
--
Bed
1
Bath
800
Sq Ft
$309/Sq Ft
Est. Value
About This Home
This home is located at 3817 W Fillmore St, Phoenix, AZ 85009 and is currently estimated at $246,915, approximately $308 per square foot. 3817 W Fillmore St is a home located in Maricopa County with nearby schools including Moya Elementary School, Morris K. Udall Middle School, and Carl Hayden High School.
Ownership History
Date
Name
Owned For
Owner Type
Purchase Details
Closed on
Jun 7, 2016
Sold by
Nunez Maria G
Bought by
Nunez Maria G
Current Estimated Value
Purchase Details
Closed on
Jul 23, 2010
Sold by
204 Won Llc
Bought by
Nunez Maria G and Nunez Blas
Purchase Details
Closed on
Jul 20, 2010
Sold by
Padilla Lisa
Bought by
204 Won Llc
Purchase Details
Closed on
Apr 10, 2007
Sold by
Padilla Salomon and Padilla Lilia P
Bought by
Padilla Lisa
Home Financials for this Owner
Home Financials are based on the most recent Mortgage that was taken out on this home.
Original Mortgage
$120,000
Interest Rate
6.13%
Mortgage Type
New Conventional
Purchase Details
Closed on
May 15, 2006
Sold by
Voogd Katharina
Bought by
Padilla Salomon and Padilla Lilia P
Home Financials for this Owner
Home Financials are based on the most recent Mortgage that was taken out on this home.
Original Mortgage
$90,000
Interest Rate
8.37%
Mortgage Type
Fannie Mae Freddie Mac
Purchase Details
Closed on
Oct 23, 2003
Sold by
Voogd Hugo
Bought by
Voogd Peter and Voogd Katharina
Create a Home Valuation Report for This Property
The Home Valuation Report is an in-depth analysis detailing your home's value as well as a comparison with similar homes in the area
Home Values in the Area
Average Home Value in this Area
Purchase History
| Date | Buyer | Sale Price | Title Company |
|---|---|---|---|
| Nunez Maria G | -- | None Available | |
| Nunez Maria G | $26,000 | Security Title Agency | |
| 204 Won Llc | $19,500 | Security Title Agency | |
| Padilla Lisa | $150,000 | Capital Title Agency Inc | |
| Padilla Salomon | $120,000 | Security Title Agency Inc | |
| Voogd Peter | -- | -- | |
| Voogd Hugo | -- | -- |
Source: Public Records
Mortgage History
| Date | Status | Borrower | Loan Amount |
|---|---|---|---|
| Previous Owner | Padilla Lisa | $120,000 | |
| Previous Owner | Padilla Salomon | $90,000 |
Source: Public Records
Tax History Compared to Growth
Tax History
| Year | Tax Paid | Tax Assessment Tax Assessment Total Assessment is a certain percentage of the fair market value that is determined by local assessors to be the total taxable value of land and additions on the property. | Land | Improvement |
|---|---|---|---|---|
| 2025 | $580 | $3,540 | -- | -- |
| 2024 | $566 | $3,372 | -- | -- |
| 2023 | $566 | $16,810 | $3,360 | $13,450 |
| 2022 | $539 | $12,260 | $2,450 | $9,810 |
| 2021 | $538 | $10,260 | $2,050 | $8,210 |
| 2020 | $528 | $9,480 | $1,890 | $7,590 |
| 2019 | $519 | $7,560 | $1,510 | $6,050 |
| 2018 | $520 | $7,720 | $1,540 | $6,180 |
| 2017 | $516 | $5,580 | $1,110 | $4,470 |
| 2016 | $500 | $5,260 | $1,050 | $4,210 |
| 2015 | $463 | $3,830 | $760 | $3,070 |
Source: Public Records
Map
Nearby Homes
- 3810 W Van Buren St
- 3619 W Taylor St
- 326 N 39th Dr
- 3640 W Garfield St
- 3803 W Portland St
- 3540 W Taylor St
- 3607 W Melvin St Unit 5
- 3828 W Latham St
- 3735 W Moreland St
- 1001 N 43rd Ave Unit 282
- 1001 N 43rd Ave Unit 15
- 3506 W Roosevelt St
- 3648 W Moreland St
- 1340 N 38th Dr
- 1516 N 37th Ave
- 3215 W Taylor St
- 3421 W Willetta St
- 3339 W Washington St Unit 2
- 2213 W Jefferson St Unit 4
- 2203 W Jefferson St Unit 1
- 3821 W Fillmore St
- 3811 W Fillmore St
- 3827 W Fillmore St
- 3807 W Fillmore St
- 3818 W Taylor St
- 3822 W Taylor St
- 3812 W Taylor St
- 3818 W Fillmore St
- 3812 W Fillmore St
- 3822 W Fillmore St
- 3828 W Taylor St
- 3808 W Taylor St
- 3801 W Fillmore St
- 3828 W Fillmore St
- 3808 W Fillmore St
- 3834 W Taylor St
- 3802 W Taylor St
- 3834 W Fillmore St
- 3802 W Fillmore St
- 3817 W Pierce St