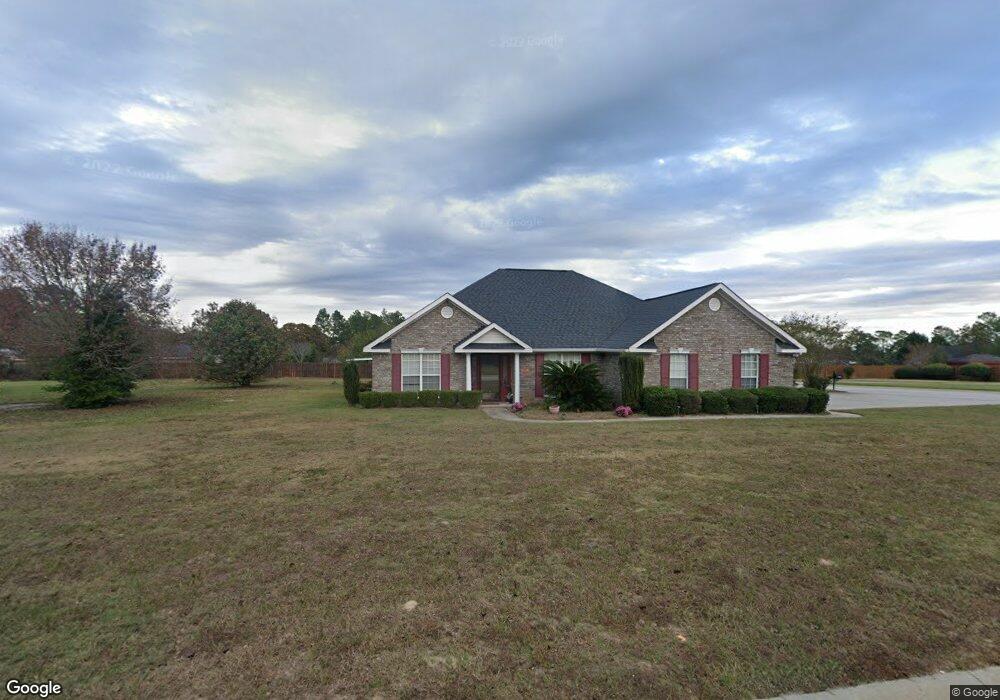
3818 Barnett Crossing Augusta, GA 30909
Belair NeighborhoodEstimated Value: $302,000 - $319,000
4
Beds
2
Baths
2,386
Sq Ft
$130/Sq Ft
Est. Value
About This Home
This home is located at 3818 Barnett Crossing, Augusta, GA 30909 and is currently estimated at $310,597, approximately $130 per square foot. 3818 Barnett Crossing is a home located in Richmond County with nearby schools including Sue Reynolds Elementary School, Langford Middle School, and Johnson Magnet.
Ownership History
Date
Name
Owned For
Owner Type
Purchase Details
Closed on
Jun 17, 2025
Sold by
Guidey Joyce
Bought by
Sams Helene L
Current Estimated Value
Purchase Details
Closed on
Aug 27, 2024
Sold by
Sams Helene L
Bought by
Guidey Joyce and Washington Wilhelimina
Purchase Details
Closed on
Mar 25, 2011
Sold by
Sams James E
Bought by
Sams Helene L
Home Financials for this Owner
Home Financials are based on the most recent Mortgage that was taken out on this home.
Original Mortgage
$163,115
Interest Rate
4.5%
Mortgage Type
FHA
Purchase Details
Closed on
Aug 1, 2002
Sold by
Sams Helene L
Bought by
Sams Helene L and Sams James Edward
Home Financials for this Owner
Home Financials are based on the most recent Mortgage that was taken out on this home.
Original Mortgage
$157,652
Interest Rate
6.53%
Purchase Details
Closed on
Mar 13, 2002
Sold by
Home Sites Ltd
Bought by
Keystone Homes Inc
Home Financials for this Owner
Home Financials are based on the most recent Mortgage that was taken out on this home.
Original Mortgage
$119,100
Interest Rate
6.85%
Mortgage Type
Construction
Create a Home Valuation Report for This Property
The Home Valuation Report is an in-depth analysis detailing your home's value as well as a comparison with similar homes in the area
Home Values in the Area
Average Home Value in this Area
Purchase History
| Date | Buyer | Sale Price | Title Company |
|---|---|---|---|
| Sams Helene L | -- | -- | |
| Guidey Joyce | $100 | -- | |
| Sams Helene L | -- | -- | |
| Sams Helene L | -- | -- | |
| Sams Helene L | $166,000 | -- | |
| Keystone Homes Inc | $18,900 | -- |
Source: Public Records
Mortgage History
| Date | Status | Borrower | Loan Amount |
|---|---|---|---|
| Previous Owner | Sams Helene L | $163,115 | |
| Previous Owner | Sams Helene L | $157,652 | |
| Previous Owner | Keystone Homes Inc | $119,100 |
Source: Public Records
Tax History Compared to Growth
Tax History
| Year | Tax Paid | Tax Assessment Tax Assessment Total Assessment is a certain percentage of the fair market value that is determined by local assessors to be the total taxable value of land and additions on the property. | Land | Improvement |
|---|---|---|---|---|
| 2024 | $1,287 | $115,152 | $15,600 | $99,552 |
| 2023 | $1,287 | $113,732 | $15,600 | $98,132 |
| 2022 | $1,432 | $110,046 | $15,600 | $94,446 |
| 2021 | $1,274 | $85,620 | $15,600 | $70,020 |
| 2020 | $1,283 | $85,620 | $15,600 | $70,020 |
| 2019 | $1,235 | $76,847 | $14,800 | $62,047 |
| 2018 | $1,242 | $76,847 | $14,800 | $62,047 |
| 2017 | $1,254 | $76,847 | $14,800 | $62,047 |
| 2016 | $1,254 | $76,847 | $14,800 | $62,047 |
| 2015 | $1,254 | $76,847 | $14,800 | $62,047 |
| 2014 | $1,192 | $71,952 | $14,800 | $57,152 |
Source: Public Records
Map
Nearby Homes
- 3465 Camak Dr
- 3605 Wrightsboro Rd
- 3655 Crawfordville Dr
- 3650 Crawfordville Dr
- 3009 Norwood Ct
- 5226 Aruba Cir
- 3246 Lexington Way
- 2928 Aylesbury Dr
- 5149 Wheeler Lake Rd
- 3314 Camak Dr
- 3312 Camak Dr
- 5129 Wheeler Lake Rd
- 1133 Brookstone Way
- 3736 Wrightsboro Rd
- 1125 Brookstone Way
- 1215 Brookstone Way
- 3106 Clarendon Ct
- 1404 Feldspar Ct
- 3233 Peninsula Dr
- 3379 Wedgewood Dr
- 3501 Camak Dr
- 3816 Barnett Crossing
- 3503 Camak Dr
- 0 Barnett Crossing
- 3502 Camak Dr
- 3814 Barnett Crossing
- 3702 Crawfordville Ct
- 3704 Crawfordville Ct
- 3506 Camak Dr
- 3505 Camak Dr
- 3819 Barnett Crossing
- 3817 Barnett Crossing
- 3706 Crawfordville Ct
- 3462 Camak Dr
- 3904 Barnett Crossing
- 3815 Barnett Crossing
- 3507 Camak Dr
- 3463 Camak Dr
- 3510 Camak Dr
- 3708 Crawfordville Ct Unit AGUSU