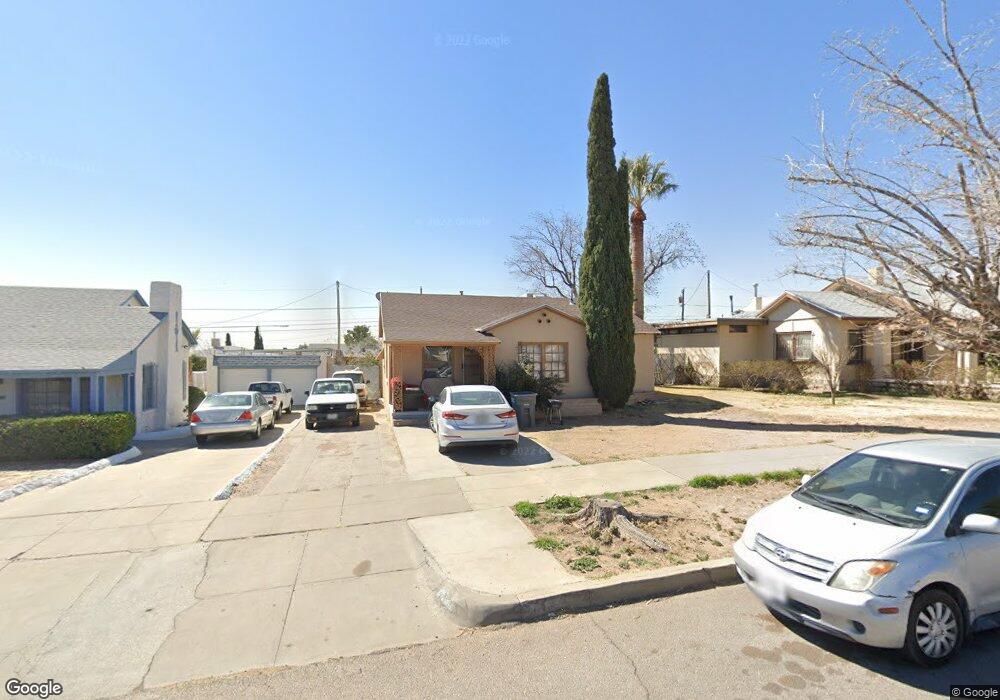
3818 Mckinley Ave El Paso, TX 79930
Central NeighborhoodEstimated Value: $134,734 - $212,000
--
Bed
2
Baths
1,291
Sq Ft
$144/Sq Ft
Est. Value
About This Home
This home is located at 3818 Mckinley Ave, El Paso, TX 79930 and is currently estimated at $185,934, approximately $144 per square foot. 3818 Mckinley Ave is a home located in El Paso County with nearby schools including Rusk Elementary School, Middle School-5 NW Middle, and Austin High School.
Ownership History
Date
Name
Owned For
Owner Type
Purchase Details
Closed on
Mar 25, 2025
Sold by
Casas Privadas Lp
Bought by
Ept Casas Privadas Ra Llc
Current Estimated Value
Home Financials for this Owner
Home Financials are based on the most recent Mortgage that was taken out on this home.
Original Mortgage
$28,784,887
Outstanding Balance
$28,369,080
Interest Rate
6.87%
Mortgage Type
New Conventional
Estimated Equity
-$28,183,146
Purchase Details
Closed on
Oct 24, 2022
Sold by
Yardeni Mike
Bought by
Ept Casas Privadas Ra Llc
Purchase Details
Closed on
Oct 5, 1999
Sold by
Cash Investments Inc
Bought by
Borrett Douglas O
Purchase Details
Closed on
Jul 13, 1999
Sold by
Carrillo Hortencia T
Bought by
Cash Investments Inc
Purchase Details
Closed on
Sep 10, 1998
Sold by
Carrillo Jaime
Bought by
Carrillo Hortencia
Create a Home Valuation Report for This Property
The Home Valuation Report is an in-depth analysis detailing your home's value as well as a comparison with similar homes in the area
Home Values in the Area
Average Home Value in this Area
Purchase History
| Date | Buyer | Sale Price | Title Company |
|---|---|---|---|
| Ept Casas Privadas Ra Llc | -- | None Listed On Document | |
| Ept Casas Privadas Ra Llc | -- | -- | |
| Borrett Douglas O | -- | -- | |
| Cash Investments Inc | -- | -- | |
| Carrillo Hortencia | -- | -- |
Source: Public Records
Mortgage History
| Date | Status | Borrower | Loan Amount |
|---|---|---|---|
| Open | Ept Casas Privadas Ra Llc | $28,784,887 |
Source: Public Records
Tax History Compared to Growth
Tax History
| Year | Tax Paid | Tax Assessment Tax Assessment Total Assessment is a certain percentage of the fair market value that is determined by local assessors to be the total taxable value of land and additions on the property. | Land | Improvement |
|---|---|---|---|---|
| 2025 | $3,426 | $136,656 | $27,931 | $108,725 |
| 2024 | $3,426 | $136,656 | $27,931 | $108,725 |
| 2023 | $3,426 | $110,000 | $15,180 | $94,820 |
| 2022 | $3,079 | $104,014 | $15,180 | $88,834 |
| 2021 | $3,252 | $104,014 | $15,180 | $88,834 |
| 2020 | $2,002 | $65,129 | $13,860 | $51,269 |
| 2018 | $1,804 | $60,967 | $13,860 | $47,107 |
| 2017 | $1,634 | $57,997 | $13,860 | $44,137 |
| 2016 | $1,777 | $63,070 | $13,860 | $49,210 |
| 2015 | $1,734 | $63,070 | $13,860 | $49,210 |
| 2014 | $1,734 | $63,381 | $13,860 | $49,521 |
Source: Public Records
Map
Nearby Homes
- 3831 Mountain Ave
- 3806 Mountain Ave
- 3901 Mckinley Ave
- 3704 Mckinley Ave
- 3921 Nations Ave
- 3905 Monroe Ave
- 3606 Morehead Ave
- 3827 Idalia Ave
- 3413 Monroe Ave
- 3510 Porter Ave
- 3906 Taylor Ave
- 3427 Hamilton Ave
- 3501 Polk Ave
- 3921 Mobile Ave
- 3501 Taylor Ave
- 3905 Nashville Ave
- 3312 Polk Ave
- 3524 Mobile Ave
- 3104 Van Buren Ave
- 3327 Mobile Ave
- 3812 Mckinley Ave
- 3828 Mckinley Ave
- 3810 Mckinley Ave
- 3830 Mckinley Ave
- 3819 Mountain Ave
- 3823 Mountain Ave
- 3815 Mountain Ave
- 3827 Mountain Ave
- 3817 Mckinley Ave
- 3809 Mountain Ave
- 3825 Mckinley Ave
- 3831 Mountain Ave Unit A
- 3831 Mountain Ave Unit B
- 3815 Mckinley Ave
- 3800 Mckinley Ave
- 3807 Mountain Ave
- 3831 Mckinley Ave
- 3809 Mckinley Ave
- 3900 Mckinley Ave
- 3801 Mountain Ave