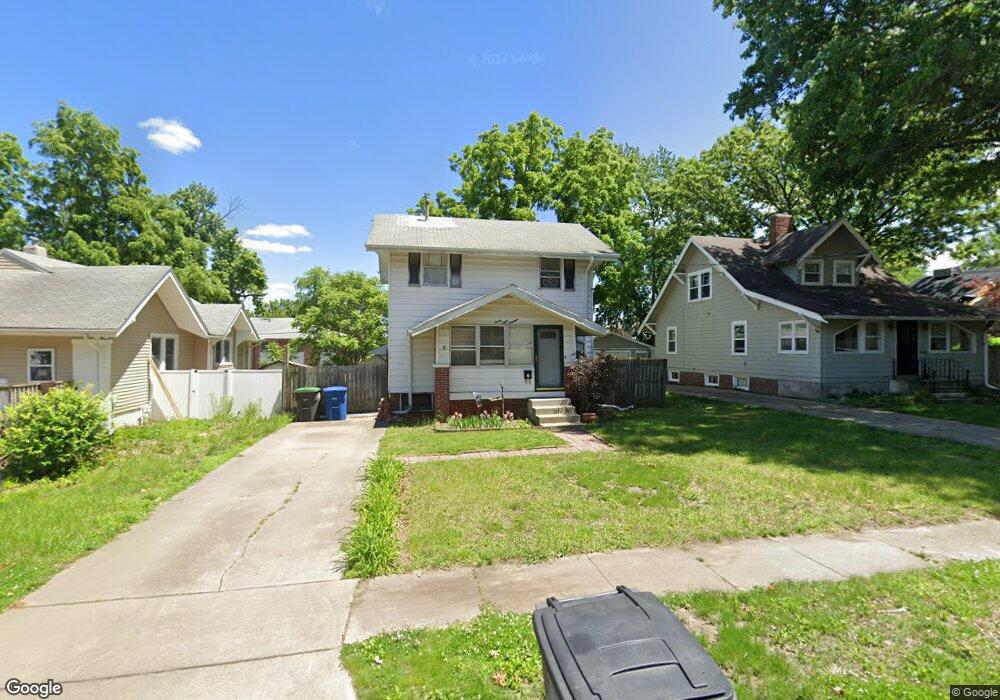
3819 7th St Des Moines, IA 50313
Oak Park NeighborhoodEstimated Value: $152,000 - $167,000
3
Beds
2
Baths
1,056
Sq Ft
$151/Sq Ft
Est. Value
About This Home
This home is located at 3819 7th St, Des Moines, IA 50313 and is currently estimated at $159,435, approximately $150 per square foot. 3819 7th St is a home located in Polk County with nearby schools including Oak Park Elementary School, Harding Middle School, and North High School.
Ownership History
Date
Name
Owned For
Owner Type
Purchase Details
Closed on
May 14, 1999
Sold by
Ledbetter Ryan C and Ledbetter Bertina L
Bought by
Glunz William L
Current Estimated Value
Home Financials for this Owner
Home Financials are based on the most recent Mortgage that was taken out on this home.
Original Mortgage
$67,500
Outstanding Balance
$17,021
Interest Rate
6.99%
Estimated Equity
$142,414
Purchase Details
Closed on
Apr 19, 1997
Sold by
Vecera John E and Vecera Wendi
Bought by
Ledbetter Ryan C and Ledbetter Bertina L
Home Financials for this Owner
Home Financials are based on the most recent Mortgage that was taken out on this home.
Original Mortgage
$60,050
Interest Rate
7.92%
Mortgage Type
FHA
Create a Home Valuation Report for This Property
The Home Valuation Report is an in-depth analysis detailing your home's value as well as a comparison with similar homes in the area
Home Values in the Area
Average Home Value in this Area
Purchase History
| Date | Buyer | Sale Price | Title Company |
|---|---|---|---|
| Glunz William L | $68,000 | -- | |
| Ledbetter Ryan C | $60,000 | -- |
Source: Public Records
Mortgage History
| Date | Status | Borrower | Loan Amount |
|---|---|---|---|
| Open | Glunz William L | $67,500 | |
| Previous Owner | Ledbetter Ryan C | $60,050 |
Source: Public Records
Tax History
| Year | Tax Paid | Tax Assessment Tax Assessment Total Assessment is a certain percentage of the fair market value that is determined by local assessors to be the total taxable value of land and additions on the property. | Land | Improvement |
|---|---|---|---|---|
| 2025 | $2,274 | $144,700 | $29,700 | $115,000 |
| 2024 | $2,274 | $126,100 | $25,800 | $100,300 |
| 2023 | $2,228 | $126,100 | $25,800 | $100,300 |
| 2022 | $2,208 | $103,400 | $21,800 | $81,600 |
| 2021 | $2,078 | $103,400 | $21,800 | $81,600 |
| 2020 | $2,154 | $91,900 | $19,500 | $72,400 |
| 2019 | $2,028 | $91,900 | $19,500 | $72,400 |
| 2018 | $2,002 | $84,000 | $17,700 | $66,300 |
| 2017 | $1,830 | $84,000 | $17,700 | $66,300 |
| 2016 | $1,778 | $76,200 | $15,900 | $60,300 |
| 2015 | $1,778 | $76,200 | $15,900 | $60,300 |
| 2014 | $1,702 | $75,400 | $15,700 | $59,700 |
Source: Public Records
Map
Nearby Homes
Your Personal Tour Guide
Ask me questions while you tour the home.