3819 Summerfield Ln NE Unit A Cedar Rapids, IA 52402
Estimated Value: $152,000 - $164,000
3
Beds
2
Baths
1,316
Sq Ft
$119/Sq Ft
Est. Value
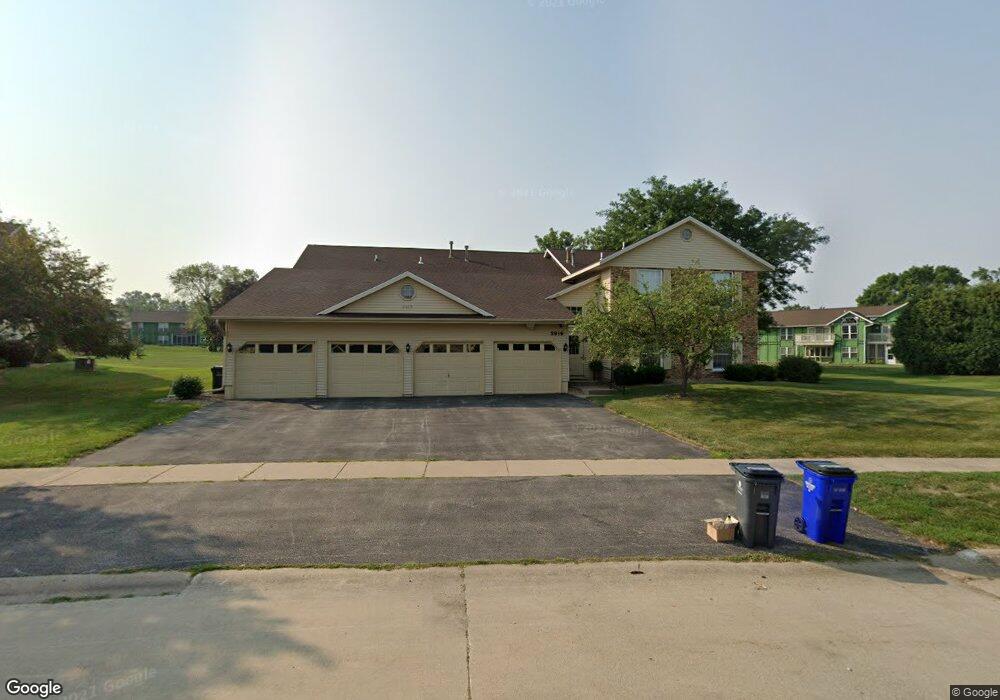
About This Home
This home is located at 3819 Summerfield Ln NE Unit A, Cedar Rapids, IA 52402 and is currently estimated at $156,851, approximately $119 per square foot. 3819 Summerfield Ln NE Unit A is a home located in Linn County with nearby schools including Ponderosa Elementary School, Pierce Elementary School, and Franklin Middle School.
Ownership History
Date
Name
Owned For
Owner Type
Purchase Details
Closed on
Jan 11, 2011
Sold by
Skilling Marilyn J
Bought by
Smith Roxanne R
Current Estimated Value
Home Financials for this Owner
Home Financials are based on the most recent Mortgage that was taken out on this home.
Original Mortgage
$60,000
Outstanding Balance
$35,314
Interest Rate
5.8%
Mortgage Type
Adjustable Rate Mortgage/ARM
Estimated Equity
$121,537
Purchase Details
Closed on
May 30, 2006
Sold by
Bachtell John F and Bachtell Joyce E
Bought by
Skilling Marilyn J
Purchase Details
Closed on
Nov 6, 2001
Sold by
Korovilas Pantelis K and Korovilas Grigorios
Bought by
Korovilas Kyriakos and Korovilas Veneta
Home Financials for this Owner
Home Financials are based on the most recent Mortgage that was taken out on this home.
Original Mortgage
$65,400
Interest Rate
6.69%
Create a Home Valuation Report for This Property
The Home Valuation Report is an in-depth analysis detailing your home's value as well as a comparison with similar homes in the area
Home Values in the Area
Average Home Value in this Area
Purchase History
| Date | Buyer | Sale Price | Title Company |
|---|---|---|---|
| Smith Roxanne R | $101,000 | None Available | |
| Skilling Marilyn J | $114,500 | None Available | |
| Korovilas Kyriakos | -- | -- |
Source: Public Records
Mortgage History
| Date | Status | Borrower | Loan Amount |
|---|---|---|---|
| Open | Smith Roxanne R | $60,000 | |
| Previous Owner | Korovilas Kyriakos | $65,400 |
Source: Public Records
Tax History Compared to Growth
Tax History
| Year | Tax Paid | Tax Assessment Tax Assessment Total Assessment is a certain percentage of the fair market value that is determined by local assessors to be the total taxable value of land and additions on the property. | Land | Improvement |
|---|---|---|---|---|
| 2025 | $2,500 | $160,200 | $19,000 | $141,200 |
| 2024 | $2,552 | $153,000 | $19,000 | $134,000 |
| 2023 | $2,552 | $151,700 | $19,000 | $132,700 |
| 2022 | $2,478 | $129,900 | $16,000 | $113,900 |
| 2021 | $2,606 | $128,600 | $16,000 | $112,600 |
| 2020 | $2,606 | $126,700 | $16,000 | $110,700 |
| 2019 | $2,394 | $119,600 | $16,000 | $103,600 |
| 2018 | $2,322 | $119,600 | $16,000 | $103,600 |
| 2017 | $2,376 | $117,600 | $8,000 | $109,600 |
| 2016 | $2,403 | $113,100 | $8,000 | $105,100 |
| 2015 | $2,451 | $115,213 | $8,000 | $107,213 |
| 2014 | $2,266 | $115,213 | $8,000 | $107,213 |
| 2013 | -- | $115,213 | $8,000 | $107,213 |
Source: Public Records
Map
Nearby Homes
- 4113 Lexington Ct NE Unit C
- 4113 Lexington Ct NE Unit A
- 3915 Lexington Dr NE Unit B
- 3608 Foxborough Terrace NE Unit B
- 3607 Foxborough Terrace NE Unit A
- 4131 Blue Jay Dr NE Unit A
- 4131 Blue Jay Dr NE Unit C
- 3524 Swallow Ct NE
- 4113 Lark Ct NE Unit 4113
- 4010 Red Cedar Dr NE Unit B
- 4417 Twin Pine Dr NE
- 3920 Wyndham Dr NE
- 5230 Edgewood Rd NE
- 4433 Coventry Ln NE
- 3719 Blue Mound Dr NE
- 3604 Heatheridge Dr NE
- 2817 Old Orchard Rd NE
- 4545 Westchester Dr NE Unit D
- 4460 Westchester Dr NE Unit C
- 4645 Westchester Dr NE Unit A
- 3819 Summerfield Ln NE
- 3819 Summerfield Ln NE
- 3819 Summerfield Ln NE
- 3819 Summerfield Ln NE Unit B
- 3819 Summerfield Ln NE Unit C
- 3913 Summerfield Ln NE Unit C
- 3913 Summerfield Ln NE Unit B
- 3913 Summerfield Ln NE Unit A
- 3913 Summerfield Ln NE
- 3818 Summerfield Ln NE
- 3818 Summerfield Ln NE
- 3818 Summerfield Ln NE Unit A
- 3818 Summerfield Ln NE Unit D
- 3818 Summerfield Ln NE Unit B
- 3813 Summerfield Ln NE
- 3813 Summerfield Ln NE
- 3813 Summerfield Ln NE
- 3813 Summerfield Ln NE
- 3813 Summerfield Ln NE Unit A
- 3813 Summerfield Ln NE Unit B