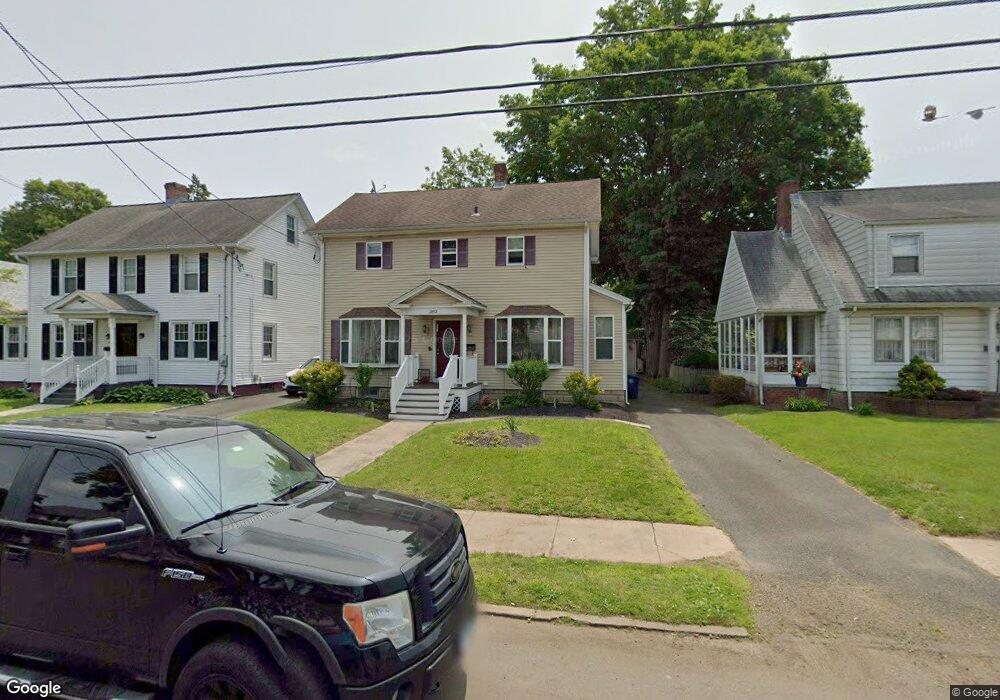
382 Center St West Haven, CT 06516
West Haven Center NeighborhoodEstimated Value: $363,000 - $473,000
3
Beds
7
Baths
1,616
Sq Ft
$246/Sq Ft
Est. Value
About This Home
This home is located at 382 Center St, West Haven, CT 06516 and is currently estimated at $397,213, approximately $245 per square foot. 382 Center St is a home located in New Haven County with nearby schools including Carrigan 5/6 Intermediate School, Harry M. Bailey Middle School, and West Haven High School.
Ownership History
Date
Name
Owned For
Owner Type
Purchase Details
Closed on
Dec 22, 2009
Sold by
Cingo Thomas
Bought by
Pope Sharon L and Jones Nakisha
Current Estimated Value
Purchase Details
Closed on
Jun 30, 2008
Sold by
Ahearn William and Ahearn George J
Bought by
Cingo Thomas
Home Financials for this Owner
Home Financials are based on the most recent Mortgage that was taken out on this home.
Original Mortgage
$127,500
Interest Rate
6.07%
Mortgage Type
Purchase Money Mortgage
Create a Home Valuation Report for This Property
The Home Valuation Report is an in-depth analysis detailing your home's value as well as a comparison with similar homes in the area
Home Values in the Area
Average Home Value in this Area
Purchase History
| Date | Buyer | Sale Price | Title Company |
|---|---|---|---|
| Pope Sharon L | $265,000 | -- | |
| Cingo Thomas | $150,000 | -- | |
| Pope Sharon L | $265,000 | -- | |
| Cingo Thomas | $150,000 | -- |
Source: Public Records
Mortgage History
| Date | Status | Borrower | Loan Amount |
|---|---|---|---|
| Previous Owner | Cingo Thomas | $127,500 |
Source: Public Records
Tax History
| Year | Tax Paid | Tax Assessment Tax Assessment Total Assessment is a certain percentage of the fair market value that is determined by local assessors to be the total taxable value of land and additions on the property. | Land | Improvement |
|---|---|---|---|---|
| 2025 | $8,385 | $242,830 | $75,740 | $167,090 |
| 2024 | $7,384 | $152,180 | $52,500 | $99,680 |
| 2023 | $7,078 | $152,180 | $52,500 | $99,680 |
| 2022 | $6,939 | $152,180 | $52,500 | $99,680 |
| 2021 | $6,939 | $152,180 | $52,500 | $99,680 |
| 2020 | $6,977 | $138,250 | $48,300 | $89,950 |
| 2019 | $6,729 | $138,250 | $48,300 | $89,950 |
| 2018 | $6,671 | $138,250 | $48,300 | $89,950 |
| 2017 | $6,312 | $138,250 | $48,300 | $89,950 |
| 2016 | $6,299 | $138,250 | $48,300 | $89,950 |
| 2015 | $6,412 | $158,900 | $51,870 | $107,030 |
| 2014 | $6,372 | $158,900 | $51,870 | $107,030 |
Source: Public Records
Map
Nearby Homes
Your Personal Tour Guide
Ask me questions while you tour the home.