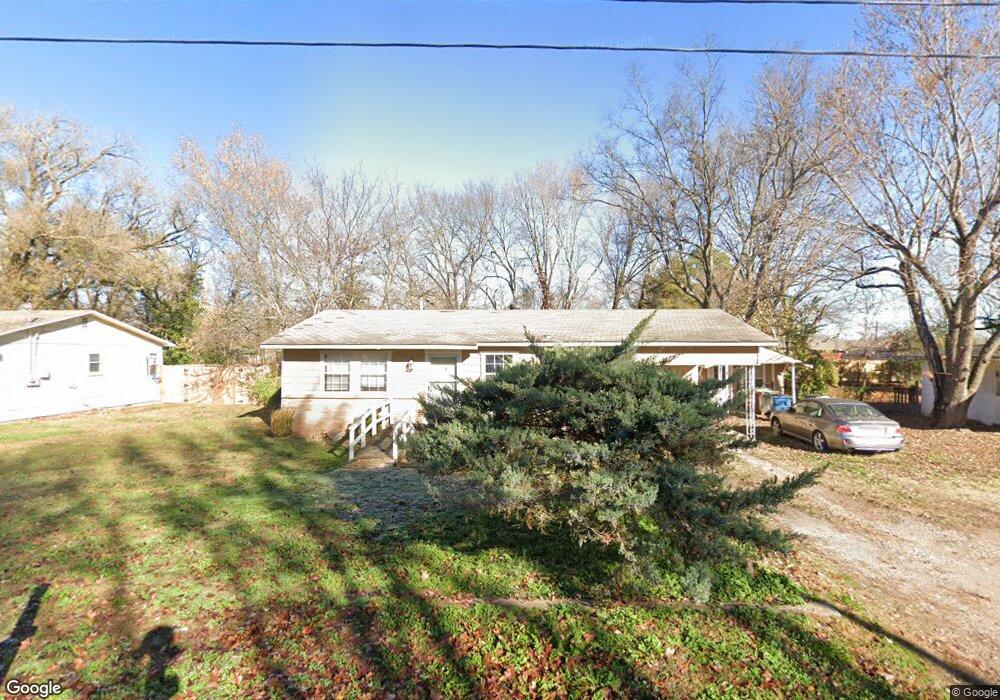
382 E Watie St Pea Ridge, AR 72751
Estimated Value: $197,930 - $276,000
--
Bed
--
Bath
1,344
Sq Ft
$164/Sq Ft
Est. Value
About This Home
This home is located at 382 E Watie St, Pea Ridge, AR 72751 and is currently estimated at $220,483, approximately $164 per square foot. 382 E Watie St is a home with nearby schools including Pea Ridge Intermediate School, Pea Ridge Primary School, and Pea Ridge Middle School.
Ownership History
Date
Name
Owned For
Owner Type
Purchase Details
Closed on
Sep 9, 2025
Sold by
Castrejon Samer
Bought by
Castrejon Efrain
Current Estimated Value
Purchase Details
Closed on
Apr 28, 2006
Sold by
Mitchell Mildred I and Mitchell Terry L
Bought by
Castrejon Efrain
Home Financials for this Owner
Home Financials are based on the most recent Mortgage that was taken out on this home.
Original Mortgage
$79,000
Interest Rate
6.36%
Mortgage Type
Purchase Money Mortgage
Create a Home Valuation Report for This Property
The Home Valuation Report is an in-depth analysis detailing your home's value as well as a comparison with similar homes in the area
Home Values in the Area
Average Home Value in this Area
Purchase History
| Date | Buyer | Sale Price | Title Company |
|---|---|---|---|
| Castrejon Efrain | -- | None Listed On Document | |
| Castrejon Efrain | $79,000 | None Available |
Source: Public Records
Mortgage History
| Date | Status | Borrower | Loan Amount |
|---|---|---|---|
| Previous Owner | Castrejon Efrain | $79,000 |
Source: Public Records
Tax History Compared to Growth
Tax History
| Year | Tax Paid | Tax Assessment Tax Assessment Total Assessment is a certain percentage of the fair market value that is determined by local assessors to be the total taxable value of land and additions on the property. | Land | Improvement |
|---|---|---|---|---|
| 2025 | $1,178 | $29,767 | $10,000 | $19,767 |
| 2024 | $1,108 | $29,767 | $10,000 | $19,767 |
| 2023 | $1,007 | $18,880 | $3,800 | $15,080 |
| 2022 | $971 | $18,880 | $3,800 | $15,080 |
| 2021 | $882 | $18,880 | $3,800 | $15,080 |
| 2020 | $828 | $13,620 | $1,500 | $12,120 |
| 2019 | $828 | $13,620 | $1,500 | $12,120 |
| 2018 | $828 | $13,620 | $1,500 | $12,120 |
| 2017 | $741 | $13,620 | $1,500 | $12,120 |
| 2016 | $741 | $13,620 | $1,500 | $12,120 |
| 2015 | $674 | $11,840 | $3,200 | $8,640 |
| 2014 | $674 | $11,840 | $3,200 | $8,640 |
Source: Public Records
Map
Nearby Homes