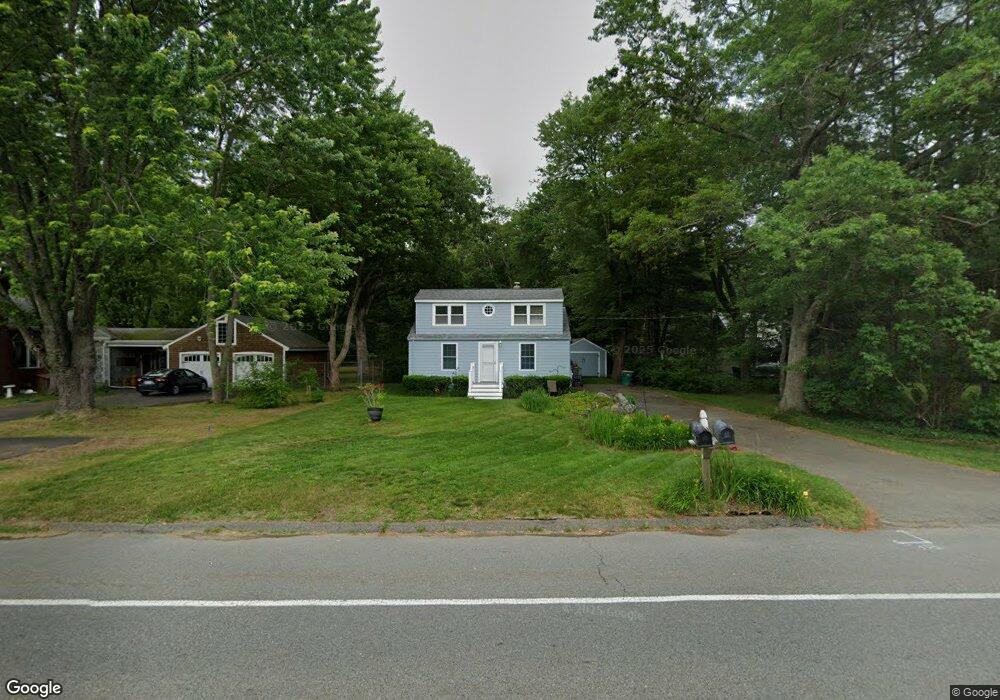
382 Elm St Mansfield, MA 02048
Estimated Value: $550,000 - $580,000
3
Beds
1
Bath
1,483
Sq Ft
$381/Sq Ft
Est. Value
About This Home
This home is located at 382 Elm St, Mansfield, MA 02048 and is currently estimated at $565,706, approximately $381 per square foot. 382 Elm St is a home located in Bristol County with nearby schools including Everett W. Robinson Elementary School, Jordan/Jackson Elementary School, and Harold L. Qualters Middle School.
Ownership History
Date
Name
Owned For
Owner Type
Purchase Details
Closed on
Oct 31, 2022
Sold by
Lynch Robert F and Lynch Viriginia M
Bought by
Lynch Julie
Current Estimated Value
Home Financials for this Owner
Home Financials are based on the most recent Mortgage that was taken out on this home.
Original Mortgage
$259,308
Outstanding Balance
$249,189
Interest Rate
6.02%
Mortgage Type
New Conventional
Estimated Equity
$316,517
Create a Home Valuation Report for This Property
The Home Valuation Report is an in-depth analysis detailing your home's value as well as a comparison with similar homes in the area
Home Values in the Area
Average Home Value in this Area
Purchase History
| Date | Buyer | Sale Price | Title Company |
|---|---|---|---|
| Lynch Julie | -- | None Available | |
| Lynch Julie | -- | None Available |
Source: Public Records
Mortgage History
| Date | Status | Borrower | Loan Amount |
|---|---|---|---|
| Open | Lynch Julie | $259,308 | |
| Closed | Lynch Julie | $259,308 |
Source: Public Records
Tax History
| Year | Tax Paid | Tax Assessment Tax Assessment Total Assessment is a certain percentage of the fair market value that is determined by local assessors to be the total taxable value of land and additions on the property. | Land | Improvement |
|---|---|---|---|---|
| 2025 | $5,846 | $443,900 | $215,200 | $228,700 |
| 2024 | $5,792 | $429,000 | $215,200 | $213,800 |
| 2023 | $5,629 | $399,500 | $215,200 | $184,300 |
| 2022 | $5,569 | $367,100 | $199,300 | $167,800 |
| 2021 | $5,209 | $339,100 | $174,300 | $164,800 |
| 2020 | $4,748 | $309,100 | $166,000 | $143,100 |
| 2019 | $4,571 | $300,300 | $138,400 | $161,900 |
| 2018 | $2,870 | $286,600 | $131,900 | $154,700 |
| 2017 | $4,204 | $279,900 | $128,100 | $151,800 |
| 2016 | $4,000 | $259,600 | $122,000 | $137,600 |
| 2015 | $3,842 | $247,900 | $122,000 | $125,900 |
Source: Public Records
Map
Nearby Homes
- 2 Oak St Unit 2B
- 14 Claire Ave
- 451R Gilbert St
- 150 Gilbert St
- 71 Richardson Ave
- 250 Mansfield Ave Unit 11
- 143 Oak St Unit 10
- 343 Godfrey Dr
- 49 Pheasant Hill Rd
- 10 Walter St
- 128 Tremont St
- 157 Mansfield Ave Unit 27
- 157 Mansfield Ave Unit 14
- 345 Richardson Ave
- 20 John F. Kennedy Dr
- 24 Maverick Dr
- 4 Village Way Unit F
- 19 Barberry Rd
- 16 Holly Rd
- 1769 West St
Your Personal Tour Guide
Ask me questions while you tour the home.