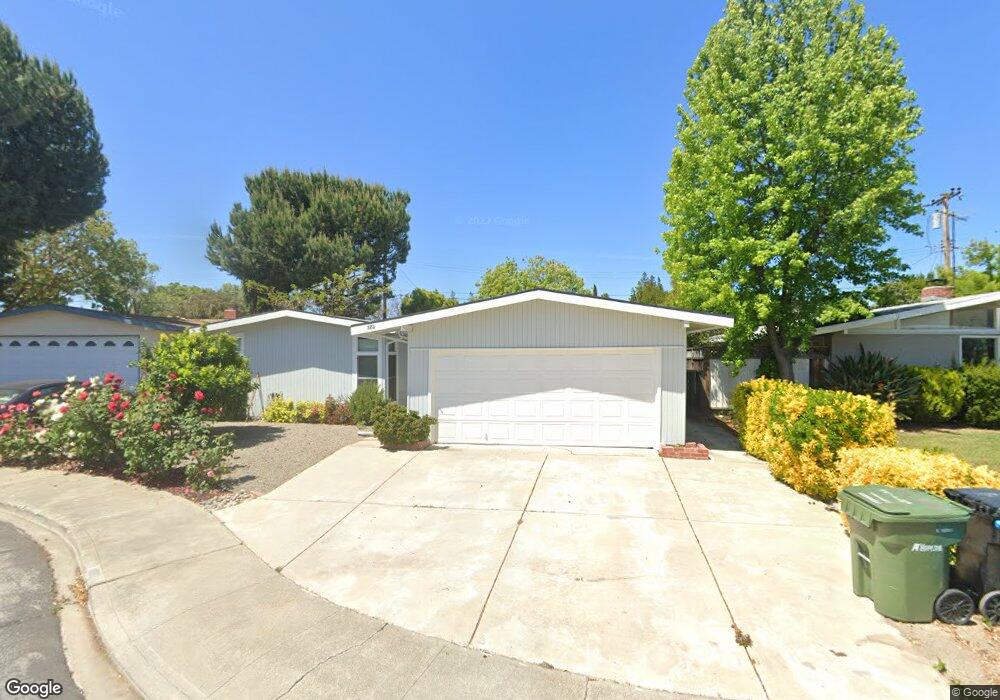
382 Manly Ct Santa Clara, CA 95051
Pruneridge NeighborhoodEstimated Value: $2,493,910 - $2,777,000
4
Beds
2
Baths
1,726
Sq Ft
$1,509/Sq Ft
Est. Value
About This Home
This home is located at 382 Manly Ct, Santa Clara, CA 95051 and is currently estimated at $2,603,728, approximately $1,508 per square foot. 382 Manly Ct is a home located in Santa Clara County with nearby schools including Dwight D. Eisenhower Elementary School, Warren E. Hyde Middle School, and Cupertino High School.
Ownership History
Date
Name
Owned For
Owner Type
Purchase Details
Closed on
Feb 23, 2017
Sold by
Moiseev Maxim P and Eidelman Olga
Bought by
Moiseev Maxim and Eidelman Olga
Current Estimated Value
Purchase Details
Closed on
May 19, 2008
Sold by
Richardson Joshua and Richardson Shabnam
Bought by
Moiseev Maxim P and Eidelman Olga
Home Financials for this Owner
Home Financials are based on the most recent Mortgage that was taken out on this home.
Original Mortgage
$50,000
Outstanding Balance
$40,922
Interest Rate
6%
Mortgage Type
Unknown
Estimated Equity
$2,562,806
Purchase Details
Closed on
Feb 11, 2003
Sold by
Kolker Keith Robert and Kolker Lee Ann
Bought by
Richardson Joshua and Richardson Shabnam
Home Financials for this Owner
Home Financials are based on the most recent Mortgage that was taken out on this home.
Original Mortgage
$430,400
Interest Rate
5.89%
Create a Home Valuation Report for This Property
The Home Valuation Report is an in-depth analysis detailing your home's value as well as a comparison with similar homes in the area
Home Values in the Area
Average Home Value in this Area
Purchase History
| Date | Buyer | Sale Price | Title Company |
|---|---|---|---|
| Moiseev Maxim | -- | None Available | |
| Moiseev Maxim P | $846,000 | First American Title | |
| Richardson Joshua | $538,000 | Fidelity National Title Ins |
Source: Public Records
Mortgage History
| Date | Status | Borrower | Loan Amount |
|---|---|---|---|
| Open | Moiseev Maxim P | $50,000 | |
| Open | Moiseev Maxim P | $626,800 | |
| Previous Owner | Richardson Joshua | $430,400 | |
| Closed | Richardson Joshua | $80,700 |
Source: Public Records
Tax History Compared to Growth
Tax History
| Year | Tax Paid | Tax Assessment Tax Assessment Total Assessment is a certain percentage of the fair market value that is determined by local assessors to be the total taxable value of land and additions on the property. | Land | Improvement |
|---|---|---|---|---|
| 2025 | $12,783 | $1,111,223 | $833,422 | $277,801 |
| 2024 | $12,783 | $1,089,435 | $817,081 | $272,354 |
| 2023 | $12,690 | $1,068,074 | $801,060 | $267,014 |
| 2022 | $12,677 | $1,047,132 | $785,353 | $261,779 |
| 2021 | $12,558 | $1,026,601 | $769,954 | $256,647 |
| 2020 | $12,417 | $1,016,076 | $762,060 | $254,016 |
| 2019 | $12,145 | $996,154 | $747,118 | $249,036 |
| 2018 | $11,867 | $976,622 | $732,469 | $244,153 |
| 2017 | $11,738 | $957,473 | $718,107 | $239,366 |
| 2016 | $11,379 | $938,700 | $704,027 | $234,673 |
| 2015 | $11,314 | $924,600 | $693,452 | $231,148 |
| 2014 | $11,020 | $906,490 | $679,869 | $226,621 |
Source: Public Records
Map
Nearby Homes
- 82 Woodhams Rd
- 680 Hamilton Ln
- 2854 Regnart Way
- 4661 Albany Cir Unit 121
- 4691 Albany Cir Unit 116
- 2831 Malabar Ave
- 2971 Salem Dr
- 4681 Albany Cir Unit 101
- 4802 Rio Vista Ave
- 2779 Mauricia Ave Unit A
- 4815 Capistrano Ave
- 2805 Sykes Ct
- 3513 Oxford Ct
- 834 Quince Ave Unit 37
- 836 Pomeroy Ave Unit 70
- 380 Richfield Dr
- 380 Auburn Way Unit 10
- 380 Auburn Way Unit 6
- 410 Auburn Way Unit 42
- 840 Quince Ave Unit 27