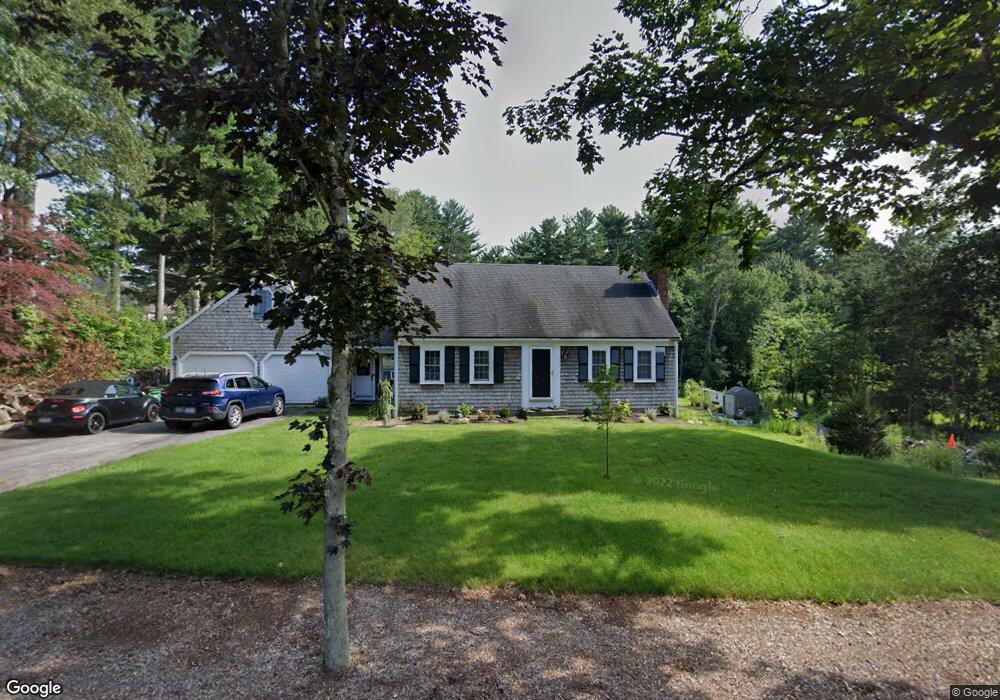
382 Oldham St Pembroke, MA 02359
Estimated Value: $595,000 - $704,000
3
Beds
2
Baths
1,672
Sq Ft
$387/Sq Ft
Est. Value
About This Home
This home is located at 382 Oldham St, Pembroke, MA 02359 and is currently estimated at $647,032, approximately $386 per square foot. 382 Oldham St is a home located in Plymouth County with nearby schools including Pembroke High School and Cardinal Cushing Centers.
Ownership History
Date
Name
Owned For
Owner Type
Purchase Details
Closed on
Mar 9, 2021
Sold by
Wilczenski David E
Bought by
Wilczenski David E and Wilczenski Gregory Debra
Current Estimated Value
Home Financials for this Owner
Home Financials are based on the most recent Mortgage that was taken out on this home.
Original Mortgage
$385,000
Interest Rate
3.1%
Mortgage Type
Stand Alone Refi Refinance Of Original Loan
Purchase Details
Closed on
Oct 22, 2008
Sold by
Costa Marjorie J and Cook Marjorie J
Bought by
Wilczenski David E and Azevedo Amy L
Home Financials for this Owner
Home Financials are based on the most recent Mortgage that was taken out on this home.
Original Mortgage
$338,833
Interest Rate
5.94%
Mortgage Type
Purchase Money Mortgage
Create a Home Valuation Report for This Property
The Home Valuation Report is an in-depth analysis detailing your home's value as well as a comparison with similar homes in the area
Home Values in the Area
Average Home Value in this Area
Purchase History
| Date | Buyer | Sale Price | Title Company |
|---|---|---|---|
| Wilczenski David E | -- | None Available | |
| Wilczenski David E | -- | None Available | |
| Wilczenski David E | $345,000 | -- | |
| Wilczenski David E | $345,000 | -- |
Source: Public Records
Mortgage History
| Date | Status | Borrower | Loan Amount |
|---|---|---|---|
| Previous Owner | Wilczenski David E | $385,000 | |
| Previous Owner | Wilczenski David E | $341,040 | |
| Previous Owner | Wilczenski David E | $338,833 |
Source: Public Records
Tax History Compared to Growth
Tax History
| Year | Tax Paid | Tax Assessment Tax Assessment Total Assessment is a certain percentage of the fair market value that is determined by local assessors to be the total taxable value of land and additions on the property. | Land | Improvement |
|---|---|---|---|---|
| 2025 | $7,128 | $593,000 | $302,200 | $290,800 |
| 2024 | $7,013 | $583,000 | $295,100 | $287,900 |
| 2023 | $6,776 | $532,700 | $270,700 | $262,000 |
| 2022 | $6,410 | $453,000 | $226,300 | $226,700 |
| 2021 | $5,984 | $410,400 | $216,400 | $194,000 |
| 2020 | $5,879 | $405,700 | $211,700 | $194,000 |
| 2019 | $5,652 | $387,100 | $201,900 | $185,200 |
| 2018 | $5,488 | $368,600 | $196,100 | $172,500 |
| 2017 | $5,418 | $358,800 | $186,300 | $172,500 |
| 2016 | $5,242 | $343,500 | $174,100 | $169,400 |
| 2015 | $4,556 | $309,100 | $166,700 | $142,400 |
Source: Public Records
Map
Nearby Homes