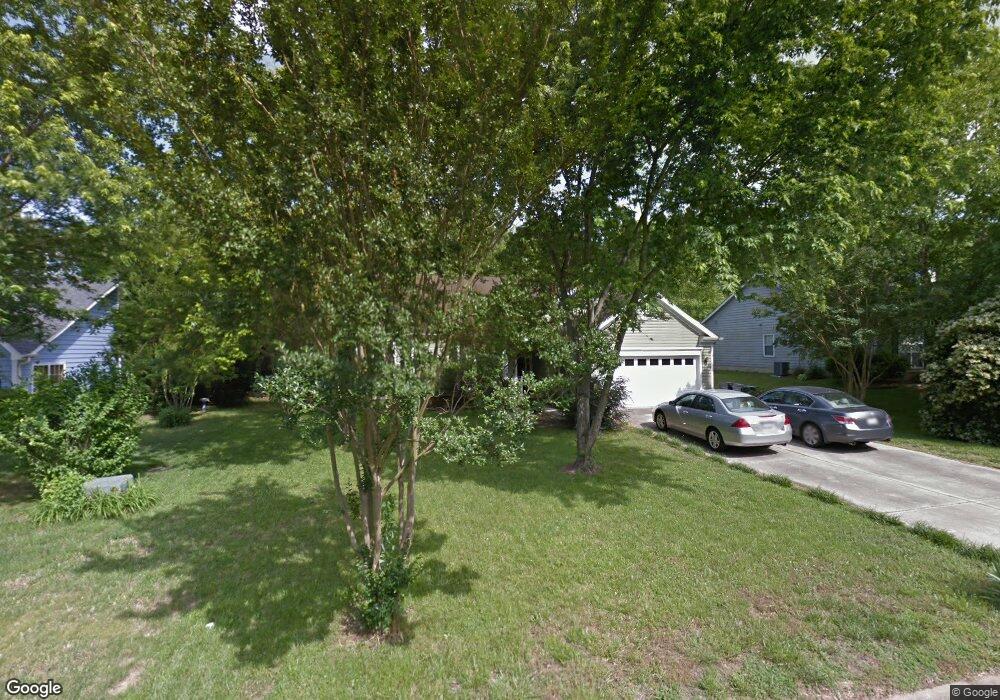
382 Queens Dr SW Concord, NC 28025
Estimated Value: $311,975 - $342,000
3
Beds
2
Baths
1,558
Sq Ft
$210/Sq Ft
Est. Value
About This Home
This home is located at 382 Queens Dr SW, Concord, NC 28025 and is currently estimated at $326,744, approximately $209 per square foot. 382 Queens Dr SW is a home located in Cabarrus County with nearby schools including Rocky River Elementary School, J.N. Fries Middle School, and Branch Christian Academy.
Ownership History
Date
Name
Owned For
Owner Type
Purchase Details
Closed on
Jul 7, 2015
Sold by
Goodman James A and Goodman Kristen J
Bought by
Amico Gina D and Amico Vincent Victor D
Current Estimated Value
Home Financials for this Owner
Home Financials are based on the most recent Mortgage that was taken out on this home.
Original Mortgage
$127,205
Outstanding Balance
$99,429
Interest Rate
3.93%
Mortgage Type
New Conventional
Estimated Equity
$227,315
Purchase Details
Closed on
Oct 6, 2000
Sold by
Woods Allen W and Woods Michele L
Bought by
Goodman James A
Home Financials for this Owner
Home Financials are based on the most recent Mortgage that was taken out on this home.
Original Mortgage
$89,200
Interest Rate
7.97%
Purchase Details
Closed on
Aug 1, 1995
Bought by
Woods Allen W and Wife Michele L
Purchase Details
Closed on
Apr 1, 1992
Create a Home Valuation Report for This Property
The Home Valuation Report is an in-depth analysis detailing your home's value as well as a comparison with similar homes in the area
Home Values in the Area
Average Home Value in this Area
Purchase History
| Date | Buyer | Sale Price | Title Company |
|---|---|---|---|
| Amico Gina D | $134,000 | None Available | |
| Goodman James A | $112,000 | -- | |
| Woods Allen W | $97,000 | -- | |
| -- | $95,000 | -- |
Source: Public Records
Mortgage History
| Date | Status | Borrower | Loan Amount |
|---|---|---|---|
| Open | Amico Gina D | $127,205 | |
| Previous Owner | Goodman James A | $89,200 |
Source: Public Records
Tax History Compared to Growth
Tax History
| Year | Tax Paid | Tax Assessment Tax Assessment Total Assessment is a certain percentage of the fair market value that is determined by local assessors to be the total taxable value of land and additions on the property. | Land | Improvement |
|---|---|---|---|---|
| 2025 | $3,054 | $306,660 | $65,000 | $241,660 |
| 2024 | $3,054 | $306,660 | $65,000 | $241,660 |
| 2023 | $2,321 | $190,240 | $40,000 | $150,240 |
| 2022 | $2,321 | $190,240 | $40,000 | $150,240 |
| 2021 | $2,321 | $190,240 | $40,000 | $150,240 |
| 2020 | $2,321 | $190,240 | $40,000 | $150,240 |
| 2019 | $1,707 | $139,890 | $17,000 | $122,890 |
| 2018 | $1,679 | $139,890 | $17,000 | $122,890 |
| 2017 | $1,651 | $139,890 | $17,000 | $122,890 |
| 2016 | $979 | $112,730 | $17,000 | $95,730 |
| 2015 | $1,330 | $112,730 | $17,000 | $95,730 |
| 2014 | $1,330 | $112,730 | $17,000 | $95,730 |
Source: Public Records
Map
Nearby Homes
- 493 Debra Cir SW
- 518 Viking Place SW
- 3168 Sossamon Place
- 3073 Champion Ln SW
- 2824 Trestle Ct SW
- 2893 Signal Ct SW
- 609 Faith Dr SW Unit 1
- 1255 Old Charlotte Rd
- Lot #2 Faith Dr SW
- 809 Fargo Dr SW
- 1067 Old Charlotte Rd
- 84 Highland Ave SW
- 82 Highland Ave SW
- 782 Chalice St SW
- 758 Main St SW
- 664 Jackson Terrace SW
- 668 Jackson Terrace SW
- 4285 Long Arrow Dr
- 933 Old Charlotte Rd
- 668 Shellbark Dr
- 386 Queens Dr SW
- 378 Queens Dr SW
- 513 Debra Cir SW
- 509 Debra Cir SW
- 390 Queens Dr SW
- 374 Queens Dr SW
- 381 Queens Dr SW
- 517 Debra Cir SW
- 505 Debra Cir SW
- 379 Queens Dr SW
- 385 Queens Dr SW
- 385 Queens Dr SW
- 370 Queens Dr SW
- 375 Queens Dr SW
- 389 Queens Dr SW
- 394 Queens Dr SW
- 516 Debra Cir SW
- 501 Debra Cir SW
- 515 Garrison Ct SW
- 366 Queens Dr SW