Estimated Value: $613,000 - $748,000
About This Home
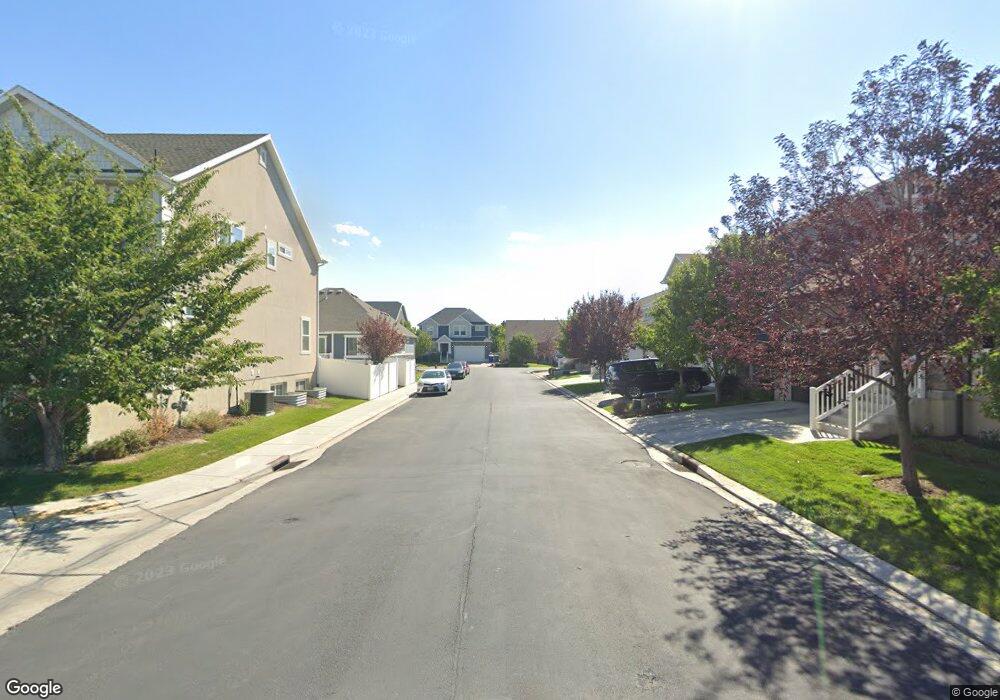
This home is located at 382 S 630 E Unit 27, Lehi, UT 84043 and is currently estimated at $684,164, approximately $181 per square foot. 382 S 630 E Unit 27 is a home located in Utah County with nearby schools including Meadow Elementary School, Lehi Junior High School, and Lehi High School.
Ownership History
We collect this data history from publicly available records. To have your information removed, we recommend requesting removal directly through your county’s website.
Purchase Details
Home Financials for this Owner
Home Financials are based on the most recent Mortgage that was taken out on this home.Purchase Details
Purchase Details
Home Financials for this Owner
Home Financials are based on the most recent Mortgage that was taken out on this home.Home Values in the Area
Average Home Value in this Area
Purchase History
We collect this data history from publicly available records. To have your information removed, we recommend requesting removal directly through your county’s website.
| Date | Buyer | Sale Price | Title Company |
|---|---|---|---|
| -- | Meridian Title Company | ||
| -- | Meridian Title Company | ||
| -- | None Available | ||
| -- | Provo Land Title Co |
Mortgage History
We collect this data history from publicly available records. To have your information removed, we recommend requesting removal directly through your county’s website.
| Date | Status | Borrower | Loan Amount |
|---|---|---|---|
| Open | $320,000 | ||
| Closed | $272,700 |
Tax History
We collect this data history from publicly available records. To have your information removed, we recommend requesting removal directly through your county’s website.
| Year | Tax Paid | Tax Assessment Tax Assessment Total Assessment is a certain percentage of the fair market value that is determined by local assessors to be the total taxable value of land and additions on the property. | Land | Improvement |
|---|---|---|---|---|
| 2025 | $2,690 | $339,625 | -- | -- |
| 2024 | $2,690 | $314,765 | $0 | $0 |
| 2023 | $2,519 | $320,045 | $0 | $0 |
| 2022 | $2,493 | $307,065 | $0 | $0 |
| 2021 | $2,232 | $415,600 | $129,600 | $286,000 |
| 2020 | $2,104 | $387,300 | $120,000 | $267,300 |
| 2019 | $1,841 | $352,400 | $120,000 | $232,400 |
| 2018 | $1,735 | $313,900 | $111,000 | $202,900 |
| 2017 | $1,613 | $155,100 | $0 | $0 |
| 2016 | $1,627 | $145,200 | $0 | $0 |
| 2015 | -- | $72,000 | $0 | $0 |
| 2014 | $634 | $53,400 | $0 | $0 |
Map
- 398 S 730 E
- 352 E 570 S Unit 26
- 793 S 350 E
- 155 E 200 S
- 312 N 720 E
- 344 N 1100 E Unit G1
- 207 W 500 S
- 418 N 1100 E Unit 1
- 160 E 400 N
- 476 S 230 W
- 484 N 950 W Unit 7
- 524 N 900 E
- 1076 W State Rd Unit 204
- 736 S 300 W
- 1371 W 950 S Unit 7
- 569 E 1540 S
- 1126 W 250 S
- 1561 E 330 N
- 1452 E 500 N
- 1125 W 250 S Unit 3
- 668 E 380 S Unit 56
- 668 E 380 S
- 648 E 380 S Unit 12
- 684 E 380 S Unit 55
- 684 E 380 S
- 661 E 420 S Unit 42
- 640 E 380 S Unit 13
- 640 E 380 S
- 698 E 380 S
- 647 E 420 S Unit 17
- 679 E 420 S Unit 43
- 659 E 380 S Unit 57
- 659 E 380 S
- 673 E 380 S Unit 58
- 641 E 420 S
- 641 E 420 S Unit 16
- 643 E 380 S Unit 11
- 697 E 420 S Unit 44
- 697 E 420 S
- 634 E 380 S
Ask me questions while you tour the home.