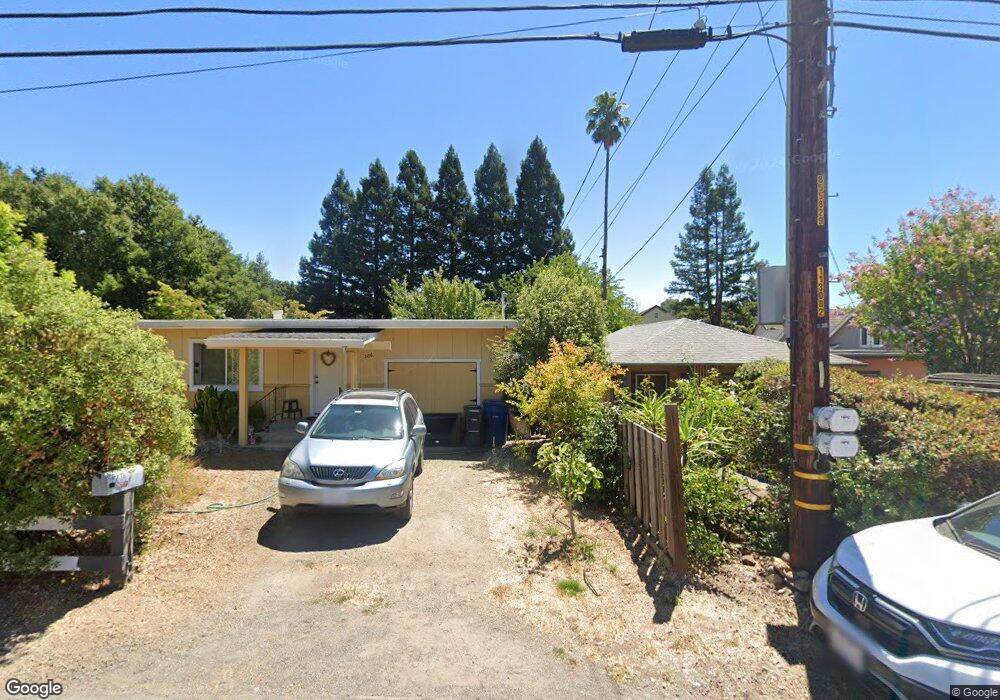
382 Siesta Way Sonoma, CA 95476
Estimated Value: $563,010 - $1,106,000
2
Beds
2
Baths
1,407
Sq Ft
$526/Sq Ft
Est. Value
About This Home
This home is located at 382 Siesta Way, Sonoma, CA 95476 and is currently estimated at $740,003, approximately $525 per square foot. 382 Siesta Way is a home located in Sonoma County with nearby schools including Flowery Elementary School, Adele Harrison Middle School, and Creekside High School.
Ownership History
Date
Name
Owned For
Owner Type
Purchase Details
Closed on
Jun 7, 2005
Sold by
Boyce Benjamin E and Boyce Sharon A
Bought by
Boyce Benjamin E and Boyce Sharon A
Current Estimated Value
Purchase Details
Closed on
Apr 22, 1997
Sold by
Oliver Donald Ray and Oliver Kathleen Diane
Bought by
Boyce Benjamin and Boyce Sharon A
Home Financials for this Owner
Home Financials are based on the most recent Mortgage that was taken out on this home.
Original Mortgage
$173,992
Outstanding Balance
$22,437
Interest Rate
7.86%
Mortgage Type
FHA
Estimated Equity
$717,566
Purchase Details
Closed on
Jan 14, 1997
Sold by
Born Freeman W and Born Donna M
Bought by
Oliver Donald Ray and Oliver Kathleen Diane
Purchase Details
Closed on
Nov 25, 1996
Sold by
Federal Home Loan Mortgage Corporation
Bought by
Oliver Donald Ray and Oliver Kathleen Diane
Purchase Details
Closed on
Aug 27, 1996
Sold by
Curtis James E
Bought by
The Federal Deposit Insurance Corp and Western Fsb
Create a Home Valuation Report for This Property
The Home Valuation Report is an in-depth analysis detailing your home's value as well as a comparison with similar homes in the area
Home Values in the Area
Average Home Value in this Area
Purchase History
| Date | Buyer | Sale Price | Title Company |
|---|---|---|---|
| Boyce Benjamin E | -- | -- | |
| Boyce Benjamin | $178,000 | North Bay Title Co | |
| Oliver Donald Ray | $57,000 | -- | |
| Oliver Donald Ray | $114,000 | Chicago Title Co | |
| The Federal Deposit Insurance Corp | $161,101 | Chicago Title Co |
Source: Public Records
Mortgage History
| Date | Status | Borrower | Loan Amount |
|---|---|---|---|
| Open | Boyce Benjamin | $173,992 |
Source: Public Records
Tax History Compared to Growth
Tax History
| Year | Tax Paid | Tax Assessment Tax Assessment Total Assessment is a certain percentage of the fair market value that is determined by local assessors to be the total taxable value of land and additions on the property. | Land | Improvement |
|---|---|---|---|---|
| 2025 | $5,960 | $284,197 | $127,727 | $156,470 |
| 2024 | $5,960 | $278,625 | $125,223 | $153,402 |
| 2023 | $5,960 | $273,163 | $122,768 | $150,395 |
| 2022 | $5,573 | $267,808 | $120,361 | $147,447 |
| 2021 | $5,398 | $262,557 | $118,001 | $144,556 |
| 2020 | $5,059 | $259,866 | $116,792 | $143,074 |
| 2019 | $5,046 | $254,771 | $114,502 | $140,269 |
| 2018 | $5,042 | $249,776 | $112,257 | $137,519 |
| 2017 | $4,840 | $244,879 | $110,056 | $134,823 |
| 2016 | $4,593 | $240,079 | $107,899 | $132,180 |
| 2015 | -- | $236,474 | $106,279 | $130,195 |
| 2014 | -- | $231,843 | $104,198 | $127,645 |
Source: Public Records
Map
Nearby Homes
- 293 Siesta Way
- 18418 1st Ave
- 350 Calle Del Monte None
- 1195 Alberca Rd
- 1200 Calle Del Arroyo
- 18010 Highway 12
- 18350 Sierra Dr
- 103 Academy Ln
- 1228 Los Robles Dr
- 18327 Sierra Dr
- 595 Michael Dr
- 773 Ernest Dr
- 18925 California 12 Unit 15
- 18346 Happy Ln
- 17701 Highland Blvd
- 17641 Highland Blvd
- 18900 Robinson Rd
- 18070 Myrtle Ave
- 17538 Highland Blvd
- 17939 Spring St