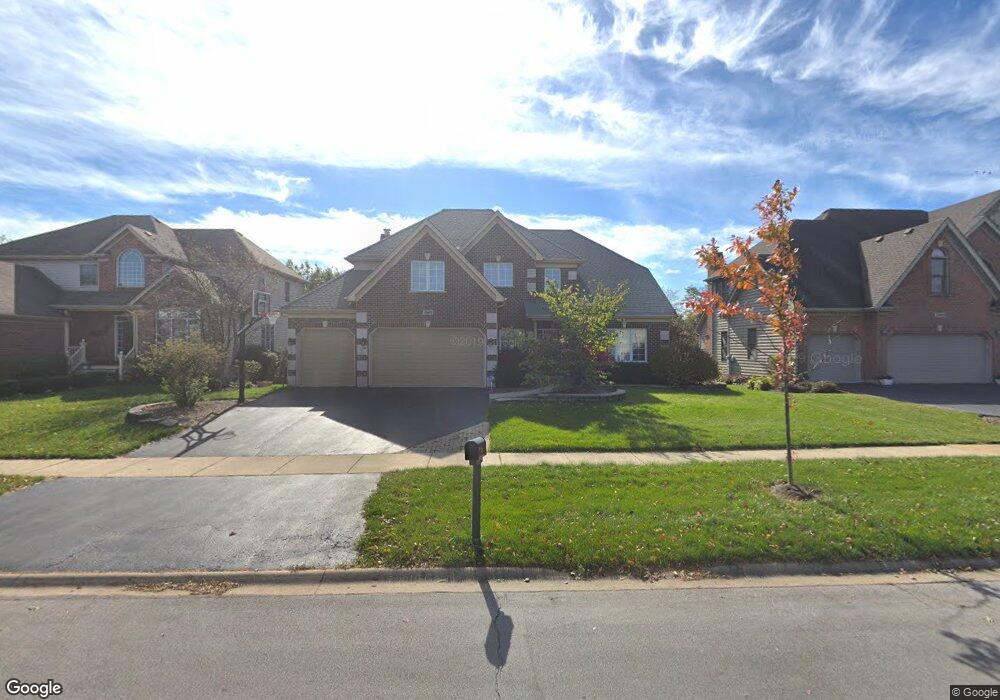
3820 Bluejay Ln Naperville, IL 60564
Tall Grass NeighborhoodEstimated Value: $873,000 - $892,000
4
Beds
4
Baths
3,454
Sq Ft
$257/Sq Ft
Est. Value
About This Home
This home is located at 3820 Bluejay Ln, Naperville, IL 60564 and is currently estimated at $886,057, approximately $256 per square foot. 3820 Bluejay Ln is a home located in Will County with nearby schools including Fry Elementary School, Scullen Middle School, and Waubonsie Valley High School.
Ownership History
Date
Name
Owned For
Owner Type
Purchase Details
Closed on
Jan 21, 2010
Sold by
Moore Todd and Moore Faye
Bought by
Narayanan Rajagopalan and Srinivasan Jai
Current Estimated Value
Home Financials for this Owner
Home Financials are based on the most recent Mortgage that was taken out on this home.
Original Mortgage
$384,800
Outstanding Balance
$255,829
Interest Rate
5.2%
Mortgage Type
New Conventional
Estimated Equity
$630,228
Purchase Details
Closed on
Nov 30, 2001
Sold by
Cameo Homes Ii Inc
Bought by
Moore Todd and Moore Faye
Home Financials for this Owner
Home Financials are based on the most recent Mortgage that was taken out on this home.
Original Mortgage
$343,000
Interest Rate
6.75%
Purchase Details
Closed on
Apr 18, 2001
Sold by
Maf Developments Inc
Bought by
Cameo Homes Ii Inc
Home Financials for this Owner
Home Financials are based on the most recent Mortgage that was taken out on this home.
Original Mortgage
$325,200
Interest Rate
7.23%
Create a Home Valuation Report for This Property
The Home Valuation Report is an in-depth analysis detailing your home's value as well as a comparison with similar homes in the area
Home Values in the Area
Average Home Value in this Area
Purchase History
| Date | Buyer | Sale Price | Title Company |
|---|---|---|---|
| Narayanan Rajagopalan | $481,000 | First American Title | |
| Moore Todd | $429,000 | Chicago Title Insurance Co | |
| Cameo Homes Ii Inc | $102,000 | Chicago Title Insurance Co |
Source: Public Records
Mortgage History
| Date | Status | Borrower | Loan Amount |
|---|---|---|---|
| Open | Narayanan Rajagopalan | $384,800 | |
| Previous Owner | Moore Todd | $343,000 | |
| Previous Owner | Cameo Homes Ii Inc | $325,200 | |
| Closed | Moore Todd | $21,400 |
Source: Public Records
Tax History Compared to Growth
Tax History
| Year | Tax Paid | Tax Assessment Tax Assessment Total Assessment is a certain percentage of the fair market value that is determined by local assessors to be the total taxable value of land and additions on the property. | Land | Improvement |
|---|---|---|---|---|
| 2024 | $16,437 | $258,953 | $66,332 | $192,621 |
| 2023 | $16,437 | $228,757 | $58,597 | $170,160 |
| 2022 | $15,241 | $216,359 | $55,432 | $160,927 |
| 2021 | $14,572 | $206,056 | $52,792 | $153,264 |
| 2020 | $14,297 | $202,792 | $51,956 | $150,836 |
| 2019 | $14,055 | $197,077 | $50,492 | $146,585 |
| 2018 | $13,858 | $190,992 | $49,381 | $141,611 |
| 2017 | $13,649 | $186,061 | $48,106 | $137,955 |
| 2016 | $13,626 | $182,055 | $47,070 | $134,985 |
| 2015 | $13,971 | $175,053 | $45,260 | $129,793 |
| 2014 | $13,971 | $173,064 | $45,260 | $127,804 |
| 2013 | $13,971 | $173,064 | $45,260 | $127,804 |
Source: Public Records
Map
Nearby Homes
- 3932 Bluejay Ln Unit 2
- 3804 Horizon Ct
- 3907 Nannyberry St
- 24531 W 103rd St
- 4052 Teak Cir
- 10533 Royal Porthcawl Dr
- 10210 Sunridge Dr
- 10526 Royal Porthcawl Dr
- 3421 Goldfinch Dr
- 10603 Royal Porthcawl Dr
- 3432 Redwing Dr Unit 2
- 24331 Davids Ct
- 3420 Lapp Ln
- 4447 Sassafras Ln
- 4215 Chinaberry Ln
- 3316 Tall Grass Dr
- 3258 Mirehaven Ct
- 3274 Mirehaven Ct
- 3273 Mirehaven Dr
- 3111 Twilight Ave
- 3816 Bluejay Ln
- 3904 Bluejay Ln Unit 2
- 3908 Bluejay Ln
- 3812 Bluejay Ln
- 3555 Vanilla Grass Dr
- 3808 Bluejay Ln Unit 2
- 3912 Bluejay Ln
- 3556 Vanilla Grass Dr
- 3907 Bluejay Ln Unit 2
- 3804 Bluejay Ln Unit 2
- 3551 Vanilla Grass Dr
- 3552 Vanilla Grass Dr
- 3559 Stackinghay Dr
- 24705 W 103rd St
- 3916 Bluejay Ln Unit 2
- 3724 Bluejay Ln Unit 2
- 3547 Vanilla Grass Dr
- 3555 Stackinghay Dr
- 3548 Vanilla Grass Dr
- 3920 Bluejay Ln