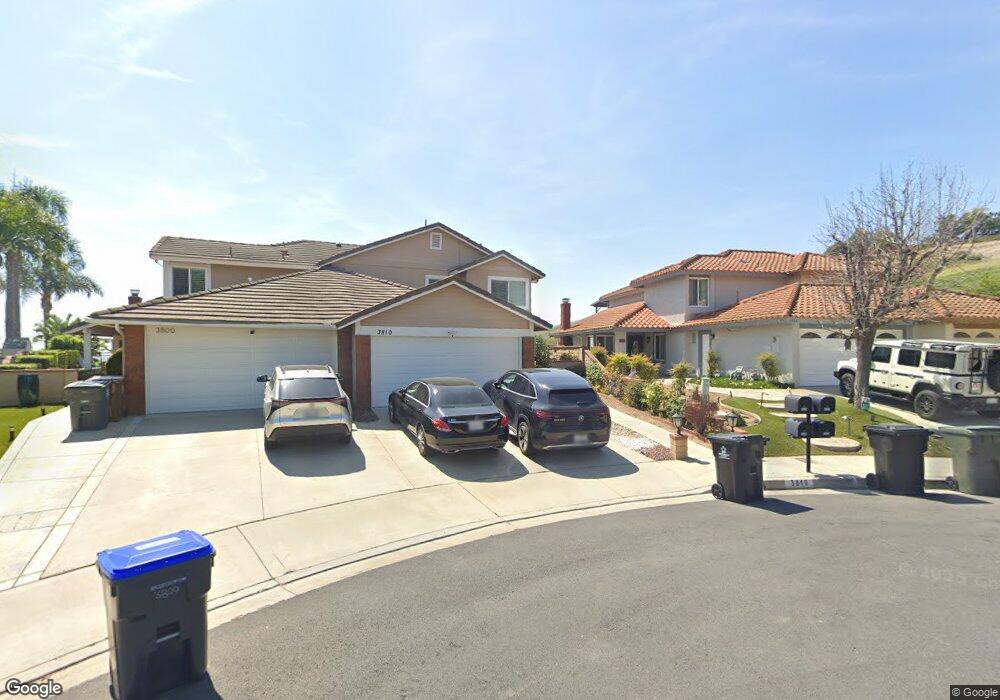
3820 Forest Glen Rd Yorba Linda, CA 92886
Estimated Value: $1,085,248 - $1,337,000
3
Beds
3
Baths
1,664
Sq Ft
$702/Sq Ft
Est. Value
About This Home
This home is located at 3820 Forest Glen Rd, Yorba Linda, CA 92886 and is currently estimated at $1,167,562, approximately $701 per square foot. 3820 Forest Glen Rd is a home located in Orange County with nearby schools including Fairmont Elementary, Bernardo Yorba Middle School, and Yorba Linda High School.
Ownership History
Date
Name
Owned For
Owner Type
Purchase Details
Closed on
Aug 27, 2019
Sold by
Topel Monique Veronica
Bought by
Topel Andrew Vincent and Topel Monique Veronica
Current Estimated Value
Home Financials for this Owner
Home Financials are based on the most recent Mortgage that was taken out on this home.
Original Mortgage
$426,000
Outstanding Balance
$374,660
Interest Rate
3.8%
Mortgage Type
New Conventional
Estimated Equity
$792,902
Purchase Details
Closed on
Jan 26, 2018
Sold by
Topel Monique Veronica and Topel Monique
Bought by
Topel Monique and Monique Topel Trust
Purchase Details
Closed on
Mar 23, 2009
Sold by
Andrukaitis Joseph and Andrukaitis Regina Louise
Bought by
Topel Andrew Vincent and Topel Monique Veronica
Home Financials for this Owner
Home Financials are based on the most recent Mortgage that was taken out on this home.
Original Mortgage
$417,000
Interest Rate
4.99%
Mortgage Type
Purchase Money Mortgage
Create a Home Valuation Report for This Property
The Home Valuation Report is an in-depth analysis detailing your home's value as well as a comparison with similar homes in the area
Home Values in the Area
Average Home Value in this Area
Purchase History
| Date | Buyer | Sale Price | Title Company |
|---|---|---|---|
| Topel Andrew Vincent | -- | Usa National Title | |
| Topel Monique | -- | None Available | |
| Topel Andrew Vincent | $530,000 | Fidelity National Title |
Source: Public Records
Mortgage History
| Date | Status | Borrower | Loan Amount |
|---|---|---|---|
| Open | Topel Andrew Vincent | $426,000 | |
| Closed | Topel Andrew Vincent | $417,000 |
Source: Public Records
Tax History Compared to Growth
Tax History
| Year | Tax Paid | Tax Assessment Tax Assessment Total Assessment is a certain percentage of the fair market value that is determined by local assessors to be the total taxable value of land and additions on the property. | Land | Improvement |
|---|---|---|---|---|
| 2025 | $8,639 | $682,377 | $475,655 | $206,722 |
| 2024 | $8,639 | $668,998 | $466,329 | $202,669 |
| 2023 | $8,468 | $655,881 | $457,185 | $198,696 |
| 2022 | $8,327 | $643,021 | $448,221 | $194,800 |
| 2021 | $8,161 | $630,413 | $439,432 | $190,981 |
| 2020 | $7,904 | $623,949 | $434,926 | $189,023 |
| 2019 | $7,730 | $611,715 | $426,398 | $185,317 |
| 2018 | $7,653 | $599,721 | $418,037 | $181,684 |
| 2017 | $7,520 | $587,962 | $409,840 | $178,122 |
| 2016 | $6,949 | $576,434 | $401,804 | $174,630 |
| 2015 | $6,866 | $567,776 | $395,769 | $172,007 |
| 2014 | $6,667 | $556,655 | $388,017 | $168,638 |
Source: Public Records
Map
Nearby Homes
- 3610 Windsong Cir
- 3695 Blue Gum Dr
- 20000 Villa Torino
- 4066 Villa Quintana
- 4090 Naples Ct
- 3635 Banyon Rim Rd
- 20100 Livorno Ln
- 4154 Princeton Place
- 4152 Beech Ave
- 3862 Ravenswood Dr
- 19818 Cornell Ln
- 4362 Via Alegre
- 3836 Jutland Ln
- 4418 Avenida Del Este
- 4446 Avenida de Las Flores
- 4545 Avenida Rio Del Oro
- 21590 Via Pepita
- 21290 Clear Haven Dr
- 91 VAC/COR E Avenue L
- 20681 Via Amarilla
- 3810 Forest Glen Rd
- 3830 Forest Glen Rd
- 3800 Forest Glen Rd
- 3790 Forest Glen Rd
- 3780 Forest Glen Rd
- 3770 Forest Glen Rd
- 3760 Forest Glen Rd
- 3750 Forest Glen Rd
- 3720 Windsong Cir
- 3710 Chaparral Ridge Dr
- 3700 Chaparral Ridge Dr
- 3740 Forest Glen Rd
- 3690 Chaparral Ridge Dr
- 3710 Windsong Cir
- 3700 Windsong Cir
- 3680 Chaparral Ridge Dr
- 3710 Forest Glen Rd
- 3700 Blue Gum Dr
- 3690 Windsong Cir
- 3720 Blue Gum Dr