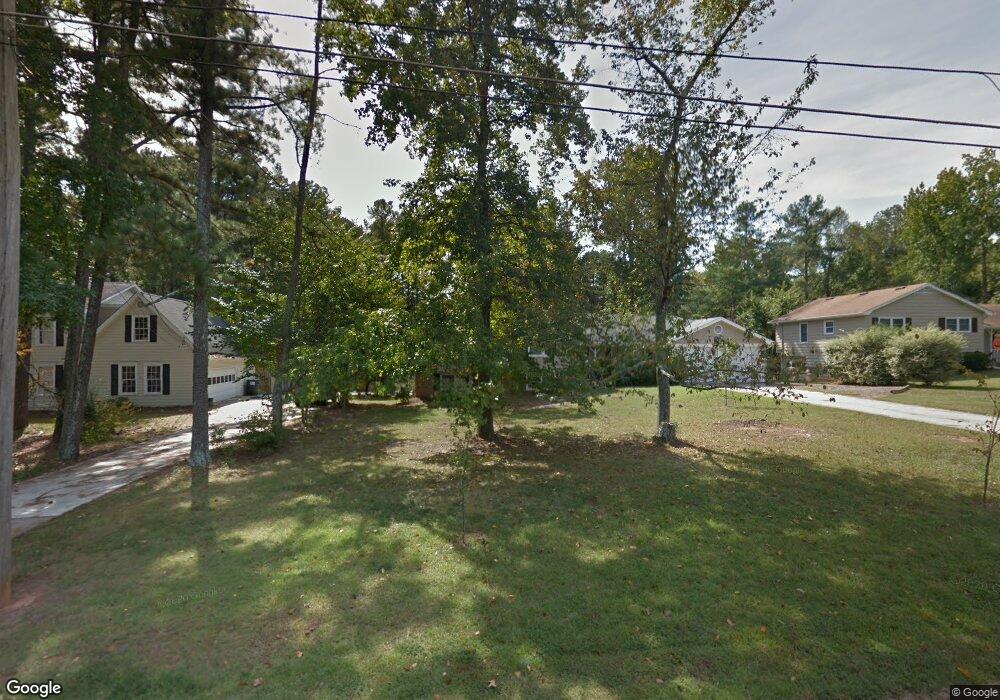
3820 Hembree Rd NE Marietta, GA 30062
East Cobb NeighborhoodEstimated Value: $430,000 - $509,326
3
Beds
3
Baths
1,900
Sq Ft
$256/Sq Ft
Est. Value
About This Home
This home is located at 3820 Hembree Rd NE, Marietta, GA 30062 and is currently estimated at $486,332, approximately $255 per square foot. 3820 Hembree Rd NE is a home located in Cobb County with nearby schools including Shallowford Falls Elementary School, Hightower Trail Middle School, and Pope High School.
Ownership History
Date
Name
Owned For
Owner Type
Purchase Details
Closed on
Jan 20, 2010
Sold by
Mcglothin Rita L
Bought by
Yates Rebecca M
Current Estimated Value
Home Financials for this Owner
Home Financials are based on the most recent Mortgage that was taken out on this home.
Original Mortgage
$104,000
Outstanding Balance
$67,974
Interest Rate
4.94%
Mortgage Type
New Conventional
Estimated Equity
$418,358
Purchase Details
Closed on
Jul 27, 2007
Sold by
Boyce Rozzelyn and Boyce Melvin H
Bought by
Mcglothin Rita L
Home Financials for this Owner
Home Financials are based on the most recent Mortgage that was taken out on this home.
Original Mortgage
$204,250
Interest Rate
6.63%
Mortgage Type
New Conventional
Purchase Details
Closed on
Oct 27, 2000
Sold by
Hudson Timothy B
Bought by
Boyce Rozzelyn G and Boyce Melvin H
Home Financials for this Owner
Home Financials are based on the most recent Mortgage that was taken out on this home.
Original Mortgage
$149,900
Interest Rate
7.44%
Mortgage Type
New Conventional
Create a Home Valuation Report for This Property
The Home Valuation Report is an in-depth analysis detailing your home's value as well as a comparison with similar homes in the area
Home Values in the Area
Average Home Value in this Area
Purchase History
| Date | Buyer | Sale Price | Title Company |
|---|---|---|---|
| Yates Rebecca M | $130,000 | -- | |
| Mcglothin Rita L | $215,000 | -- | |
| Boyce Rozzelyn G | $149,900 | -- |
Source: Public Records
Mortgage History
| Date | Status | Borrower | Loan Amount |
|---|---|---|---|
| Open | Yates Rebecca M | $104,000 | |
| Previous Owner | Mcglothin Rita L | $204,250 | |
| Previous Owner | Boyce Rozzelyn G | $149,900 |
Source: Public Records
Tax History Compared to Growth
Tax History
| Year | Tax Paid | Tax Assessment Tax Assessment Total Assessment is a certain percentage of the fair market value that is determined by local assessors to be the total taxable value of land and additions on the property. | Land | Improvement |
|---|---|---|---|---|
| 2025 | $1,468 | $182,984 | $54,000 | $128,984 |
| 2024 | $1,478 | $184,876 | $48,000 | $136,876 |
| 2023 | $1,220 | $167,732 | $36,000 | $131,732 |
| 2022 | $1,378 | $151,736 | $30,000 | $121,736 |
| 2021 | $3,621 | $119,308 | $26,000 | $93,308 |
| 2020 | $3,076 | $101,360 | $26,000 | $75,360 |
| 2019 | $3,076 | $101,360 | $26,000 | $75,360 |
| 2018 | $3,076 | $101,360 | $26,000 | $75,360 |
| 2017 | $2,399 | $83,444 | $30,000 | $53,444 |
| 2016 | $2,399 | $83,444 | $30,000 | $53,444 |
| 2015 | $2,055 | $69,740 | $22,000 | $47,740 |
| 2014 | $1,545 | $52,000 | $0 | $0 |
Source: Public Records
Map
Nearby Homes
- 3262 Carriage Way
- 3273 Carriage Way
- 2961 Connie St
- 3333 N Hembree Rd
- 2942 Graham Gardens Ln
- 3222 Bluff Rd
- 4150 Chimney Heights NE
- 2786 Long Grove Dr
- 3148 Cherbourg Ct
- 3314 Chimney Ln NE
- 3701 Shallowford Rd
- 4146 Chimney Lake Dr NE
- 2997 Gateland Square
- 3447 Dry Creek Rd
- 3503 Liberty Ridge Trail
- 2872 Suffolk Ct
- 16 Alicia Ct
- 285 Ashleigh Terrace Unit 3
- 3605 Shallowford Rd
- 2864 Sudbury Ct
- 3830 Hembree Rd NE
- 3810 Hembree Rd NE
- 3840 Hembree Rd NE
- 3800 Hembree Rd NE
- 3160 Hembry Ct
- 3144 N Meadow Ct
- 3134 N Meadow Ct
- 3175 Hembry Ct Unit 18
- 3175 Hembry Ct
- 3790 Hembree Rd NE
- 3170 Hembry Ct
- 3135 N Meadow Ct
- 3175 Lassiter Rd
- 3151 Lassiter Rd
- 3124 N Meadow Ct
- 3141 Lassiter Rd
- 3185 Hembry Ct
- 3131 Lassiter Rd
- 3180 Hembry Ct
- 3125 N Meadow Ct